Why Every Shopify Store Needs a Profit Analytics App in 2026
Shopify tells you how much you sold. It doesn't tell you how much you kept. Here's exactly what's missing from Shopify's native analytics — the six profit blind spots most merchants don't know they have — and why the gap between revenue and real margin has never mattered more than it does in 2026.

Shopify's analytics dashboard is genuinely good at what it does. Sessions, conversion rates, top products by revenue, traffic sources, order trends — all of it is accurate, well-presented, and updated in real time. If you want to know how much revenue your store generated last Tuesday, Shopify can tell you in seconds.
What it cannot tell you is how much of that revenue you kept.
That distinction — between revenue and profit — is the entire story of whether a Shopify business is healthy or not. And in 2026, with ad costs 20–40% higher than two years ago, processing fees spread across multiple platforms, supplier prices drifting upward without announcement, and return rates at their highest in ecommerce history, the gap between what a store makes and what it keeps has never been more consequential. Flying blind on that gap isn't a minor inefficiency. It's the reason stores that look like they're growing are often standing still.
What Shopify's Native Reports Actually Show You
Shopify's analytics covers four areas well:
Revenue and sales data: Total sales, orders, average order value, and revenue by product, channel, or time period. Accurate and detailed.
Traffic and conversion: Sessions, conversion rate, traffic sources, and where visitors drop off in the funnel. Useful for marketing decisions.
Product performance: Which products sell most by volume and revenue. Helpful for inventory planning and merchandising.
Customer behaviour: New vs returning customers, customer lifetime value estimates, geographic distribution.
All of this is useful. None of it is profit.
Shopify shows you gross revenue — money collected from customers before any costs are deducted. The costs that determine whether you actually made money on those sales live entirely outside Shopify's reporting:
- Product cost (COGS) — what you paid your supplier per unit, which Shopify stores in a cost field but doesn't factor into profit reports unless you're on Advanced or Plus
- Shipping costs — what you paid to fulfil the order, which may differ from what you charged
- Payment processing fees — 2.9% + 30¢ per transaction on Basic, already taken before your payout
- App subscriptions — spread across separate monthly invoices, never appearing in order-level reports
- Ad spend — recorded in Meta, Google, or TikTok, invisible to Shopify entirely
- Chargebacks and returns — deducted from payouts at irregular intervals, disconnected from the original order
These costs are real. They're already happening. They're just invisible inside Shopify — which means every decision you make from a Shopify report is a decision made without knowing your margin.
The Six Things You're Flying Blind On
1. Which Products Are Actually Profitable
Shopify's top products report ranks by revenue. A product generating $8,000/month in revenue with a 25% margin contributes $2,000 in gross profit. A product generating $3,000/month with a 65% margin contributes $1,950. They look nearly identical in Shopify's revenue report — one product is $8k and one is $3k — but they're almost identical in what matters.
Without per-product profit visibility, most merchants scale their biggest revenue products rather than their most profitable ones. That's not the same thing, and the difference compounds across every scaling decision you make.
2. Whether Your Ad Campaigns Are Profitable
Meta Ads Manager shows ROAS — revenue per dollar spent on ads. Shopify shows revenue. Neither shows you gross profit per ad-attributed order minus the product cost, shipping, and platform fees that apply to that order.
A 3x ROAS campaign on a product with 30% gross margin generates $0.90 in gross profit for every dollar of ad spend. After Shopify fees and shipping, that campaign is losing money — and the ROAS dashboard says it's performing well. Without connecting ad spend to per-order profit, you're scaling campaigns by the wrong metric and potentially accelerating losses.
3. Your True Net Margin on Each Sale
Gross margin (what Shopify approaches) and net margin (what you actually keep) are different numbers. A product with a 55% gross margin on paper might net 18% after ad spend, apps, chargebacks, and returns. That's still a viable business — but 18% is a number you need to know precisely, because it determines your break-even volume, your pricing floor, and how much room you have to absorb cost increases before the model breaks.
4. When Supplier Costs Have Drifted
Supplier prices change. They rarely announce it. You update your Shopify cost field when you remember, which may not be monthly, or quarterly, or ever. The cost drift problem is insidious: your margin appears stable in the dashboard because the cost field hasn't changed, while your actual margin has been declining for months because your supplier quietly raised prices on the last three reorders.
A profit analytics tool that updates cost per order from current purchase data — rather than a static field — catches this drift when it happens, not six months later when you can't figure out why profits are down despite stable revenue.
5. The Real Impact of Returns and Chargebacks
Returns and chargebacks appear in Shopify as negative revenue adjustments. What they don't show is the full cost: the original outbound shipping (non-recoverable), the return shipping (if your policy covers it), the product that may not be resaleable, the chargeback fee ($15 on Shopify Payments in the US), and the non-refunded processing fee on the original transaction.
A 4% return rate on a $50 product isn't a 4% revenue reduction. It's closer to a 6–8% total cost impact once the full cost stack is counted. Without per-order profit visibility on returns, you're underestimating the cost of every return event and potentially pricing too low to absorb them.
6. Which Sales Channels Are Worth Keeping
Selling on Shopify, Etsy, and Amazon simultaneously means three different fee structures, three different customer acquisition costs, and three different return rates — all generating revenue that lands in Shopify's consolidated dashboard as if it came from the same place at the same cost.
Etsy charges 6.5% transaction fees plus ~3% payment processing. Amazon charges 15% referral fees plus optional FBA costs. Your Shopify store charges 2.9% + 30¢. These aren't the same, and which channel is most profitable per order often contradicts which channel drives the most volume. Without channel-level profit data, you can't make intelligent decisions about where to focus inventory, marketing spend, or operational energy.
Why This Matters More in 2026 Than It Did in 2021
The margin environment has shifted materially in the last four years. Three changes make profit visibility more critical now than it's ever been.
Ad costs are higher. Meta CPMs rose approximately 20% year-over-year in 2025 alone, continuing a multi-year trend. A customer acquisition cost that was $8 in 2021 might be $18–$25 for the same product today. The margin that used to absorb a $8 CAC comfortably doesn't survive a $22 CAC without rebalancing product pricing, supplier costs, or ad strategy.
Shopify's processing fee structure is more complex. Premium card surcharges, international card surcharges, and third-party gateway fees mean blended processing rates vary significantly order by order. A store processing 30% international cards and 20% Amex cards is paying meaningfully more than the headline plan rate on nearly half its orders — without any single report showing the aggregate impact.
The return environment has worsened. Consumer expectations set by Amazon's frictionless return policies have raised return rates across ecommerce. Each return is a complex cost event that Shopify's dashboard simplifies into a revenue reversal, hiding the full economic impact from any merchant who isn't tracking it in detail.
What a Profit Analytics App Actually Does
A purpose-built Shopify profit analytics app closes every gap listed above by doing one thing Shopify's native tools don't: connecting all the cost sources to the individual order level.
Instead of revenue in Shopify, ad spend in Meta, product costs in a spreadsheet, and shipping fees in a carrier portal — a profit analytics app pulls them all together and shows you, per order, per product, and per channel:
- True gross profit (revenue minus product cost, shipping, and payment fees)
- True net profit (gross profit minus allocated ad spend)
- Margin by product, by SKU, by channel, and by time period
- Real-time cost drift alerts when supplier costs or shipping rates move
- Accurate return and chargeback cost tracking including fees, not just revenue reversals
The result is a single dashboard that answers the question Shopify can't: not "how much did we sell?" but "how much did we keep, and on what?"
The Decision Quality Improvement
Every business decision a Shopify merchant makes is downstream of data. Which products to scale. Which campaigns to fund. Which channels to prioritise. Whether the current pricing is sustainable. Whether a cost increase from a supplier can be absorbed or needs to trigger a price change.
All of these decisions are made better with accurate profit data than with revenue data. The merchant who knows they're making $11.40 per order on Product A and $3.20 per order on Product B — after every cost — makes a different inventory and marketing decision than the merchant who sees $45 revenue on Product A and $38 revenue on Product B and assumes A is more profitable.
The gap between those two decisions, compounded across a year of business operations, is the difference between a store that scales profitably and one that scales revenue while the margin quietly compresses.
Syncost: Built for Exactly This Gap
Syncost is the profit analytics tool built specifically for Shopify merchants who are tired of making decisions from a revenue dashboard that doesn't show costs.
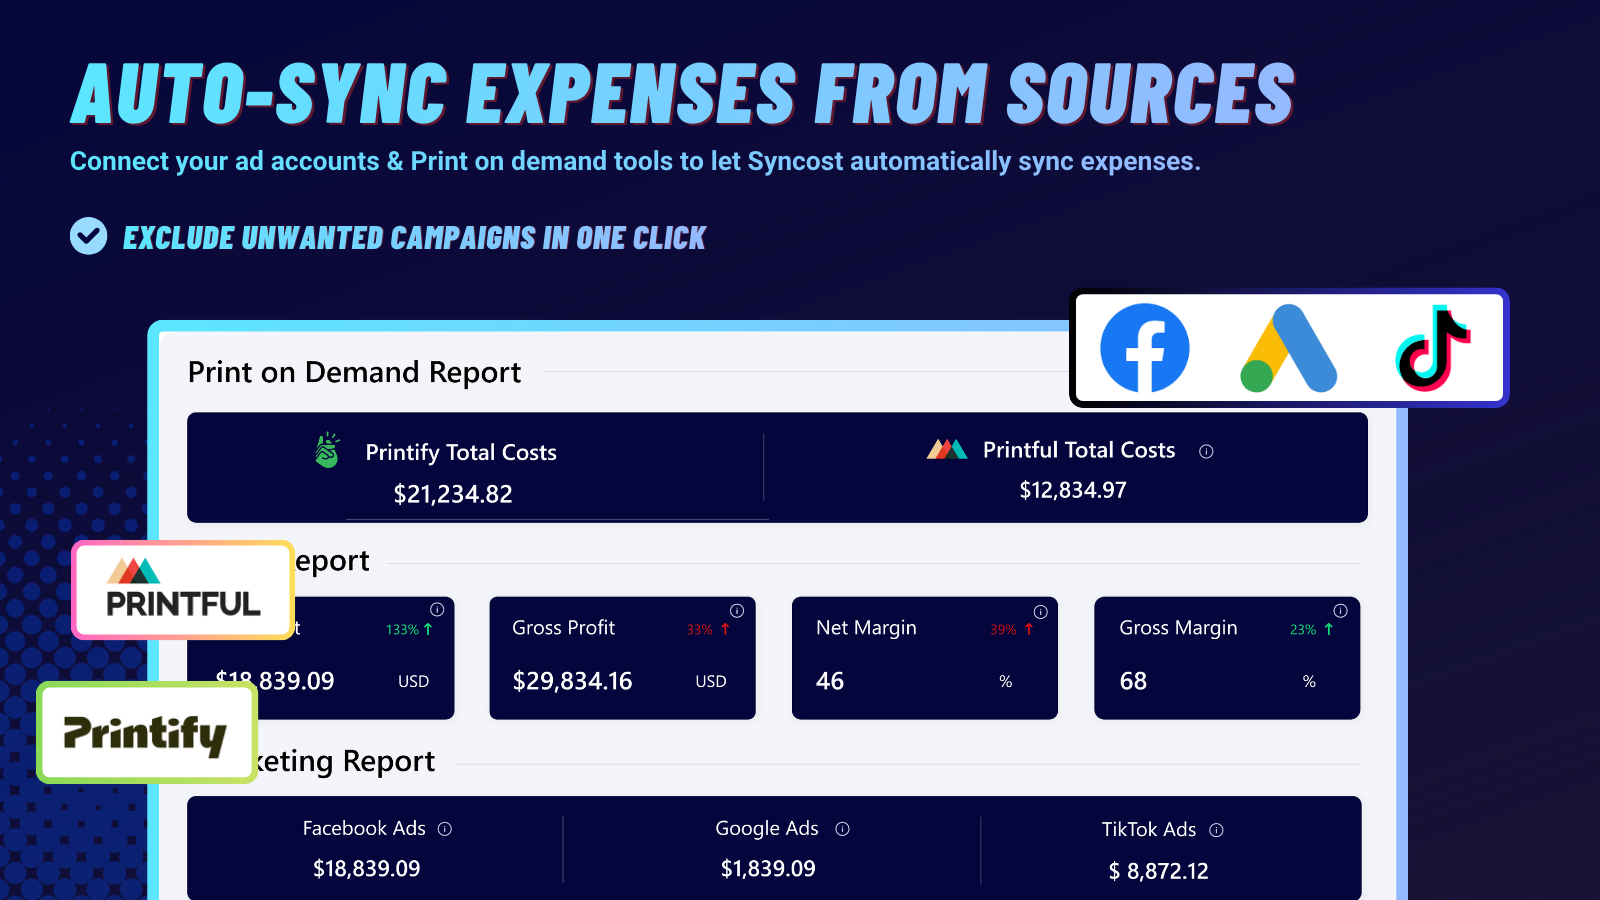
It automatically connects your product costs, Shopify payment fees, shipping costs, and ad spend — from Meta, Google, and other channels — into a single per-order profit view. Every order shows its true net profit. Every product shows its real margin. Every channel shows what it actually costs and returns, not just what revenue it generates.
For a dropshipping store, it surfaces whether each supplier relationship is actually margin-positive after all fees. For a print-on-demand store, it shows which designs are genuinely profitable versus which are generating volume at low or negative margin. For a DTC brand running paid traffic, it connects ad spend to per-order profit so ROAS gives way to the metric that matters: does this campaign generate more gross profit than it costs to run?
The stores that win in 2026 aren't the ones with the highest revenue. They're the ones that know their margin on every order and act on it — cutting what looks good but isn't, scaling what the data confirms is working, and never spending another month wondering why the bank account doesn't reflect the dashboard.
That's what Syncost is built to deliver. Not more revenue data. The profit clarity that makes revenue data actually useful.
→ See your real profit on every order at syncost.com
Shopify analytics features and plan capabilities reflect publicly available 2026 information. Processing fee structures and chargeback fees are based on Shopify's current US merchant rates.