How to Read a P&L Statement as an Ecommerce Seller
A P&L statement answers the question Shopify's dashboard never does: did we actually make money last month? Here's every line of an ecommerce P&L explained with real numbers — gross sales, COGS, contribution margin, ad spend, operating profit, and net profit — plus the three margins that tell you whether your product, marketing, and business model are actually working.

Most ecommerce sellers know they should be looking at a profit and loss statement. Fewer know how to actually read one — and even fewer know that the standard P&L format, designed for general businesses, needs to be read differently when your revenue comes from Shopify, your biggest cost is Meta ads, and your margin can swing 15 points based on a supplier price change nobody announced.
A P&L isn't just an accounting document. For an ecommerce business, it's the one report that answers the question Shopify's dashboard never does: did we actually make money last month? This guide walks through every line of an ecommerce P&L — what it means, what healthy looks like, and where the numbers most commonly mislead.
What a P&L Statement Is (And What It Isn't)
A profit and loss statement — also called an income statement — is a financial report that summarises your revenues, costs, and expenses over a specific period. Monthly is the standard cadence for ecommerce. The statement flows from the top line (what customers paid you) down through every cost layer to the bottom line (what you actually kept).
A profit and loss statement for ecommerce is a financial report that tracks revenue, cost of goods sold, variable costs, and operating expenses over a period. For Shopify brands, the format that actually works is contribution margin: gross sales at the top, every variable cost stripped out next, then fixed OpEx below the line.
What a P&L is not: a cash flow statement (which tracks when money moves), a balance sheet (which tracks assets and liabilities), or a Shopify analytics report (which tracks revenue, not profit). The P&L is a profitability document. Its job is to show whether the business earned more than it spent — and by how much.
The P&L Line by Line: An Ecommerce Walkthrough
Here's a representative P&L for a Shopify store doing roughly $40,000 in monthly revenue, with each line explained.
Gross Sales
What it is: The total value of orders placed, before any deductions. Every item sold at full price, every sale item, every order — summed up.
What to watch: Gross sales is the number Shopify shows on its analytics dashboard and the number most merchants fixate on. It's a useful measure of demand and growth momentum, but it's the least accurate measure of financial health — because nothing has been deducted yet.
Example: $43,200
Less: Returns and Discounts
What it is: Refunds processed for returned orders, plus the value of discount codes applied at checkout. Both reduce the revenue you actually received from customers.
What to watch: Returns, refunds, and discounts need to come off before anything else. Reporting gross revenue instead of net revenue overstates the top line and distorts every margin calculation downstream. A store with strong gross sales but a 20% return rate is a fundamentally different business than one with identical gross sales and a 3% return rate. The average ecommerce return rate sits at roughly 19–20% of online orders heading into 2026.
Example: −$3,200 (returns) −$800 (discounts) = −$4,000
Net Revenue (Net Sales)
What it is: Gross sales minus returns and discounts. The actual revenue the business received from customers.
What to watch: This is your real top line — the number every downstream margin calculation should use. If you sell across multiple channels like Shopify, Amazon, and a direct website, it's worth breaking revenue down by channel. Different platforms carry different cost profiles, so knowing where revenue comes from lets you evaluate profitability at the channel level.
Example: $43,200 − $4,000 = $39,200
Cost of Goods Sold (COGS)
What it is: The direct costs of the products you sold — what you paid your supplier or manufacturer per unit, plus inbound freight, duties, and packaging if applicable.
What to watch: COGS is the most commonly understated line on an ecommerce P&L. The most commonly missed COGS items are inbound freight, duties, storage, fulfillment fees, packaging, and prep costs. If your COGS only includes the supplier invoice and not freight or import duties, your gross margin is overstated — sometimes significantly.
Also critical: COGS should reflect current supplier prices, not historical ones. A supplier price increase that hasn't been updated in your cost tracking makes your margin look better than it is on every unit sold since the change.
Example: −$13,720 (supplier cost on units sold)
Gross Profit
What it is: Net revenue minus COGS. The profit generated purely from selling the product before any operating costs.
Formula: Net Revenue − COGS = Gross Profit
What to watch: Gross profit margin — gross profit divided by net revenue — is the most important single metric for evaluating your product economics. NYU Stern data shows that online retailers average a 41.54% gross profit margin. Ecommerce businesses should target 45–70%. A gross margin below 35% leaves very little room for marketing costs and platform fees before the business turns net-negative.
Example: $39,200 − $13,720 = $25,480 (65% gross margin)
Variable Operating Costs
This section is where the standard P&L format most often fails ecommerce sellers. Variable costs — costs that scale with revenue — should be separated from fixed costs because they directly determine whether each incremental sale is profitable.
Shipping and Fulfilment
What you paid carriers and fulfilment providers to deliver orders to customers. This is often higher than merchants estimate, especially once surcharges, rural delivery premiums, and dimensional weight pricing are factored in.
Example: −$4,700
Payment Processing Fees
Shopify Payments takes 2.4–2.9% + $0.30 per transaction. On a $10,000 month, that's $300+ in fees you can't ignore. At $39,200 in net revenue on Shopify Basic (2.9% + 30¢), processing fees run approximately $1,290 — before accounting for the premium card and international card surcharges that apply on a portion of transactions.
Example: −$1,290
Ad Spend
For a DTC operator, contribution margin takes profitability a step further by subtracting all the other variable costs that come with selling and shipping a product — of which ad spend is the largest. Ad spend should appear as a variable operating cost on the P&L, not lumped with fixed overhead, because it scales (ideally) with revenue and because isolating it is what allows you to calculate contribution margin accurately.
Example: −$6,800
Contribution Margin
What it is: Net revenue minus COGS minus all variable costs. The amount each sale contributes toward covering fixed costs and generating profit.
Formula: Gross Profit − Shipping − Processing Fees − Ad Spend = Contribution Margin
What to watch: Contribution margin tells you whether each order makes money before overhead. If your P&L doesn't show contribution margin on a single line, you can't answer the only question that matters.
Example: $25,480 − $4,700 − $1,290 − $6,800 = $12,690 (32.4% contribution margin)
Fixed Operating Expenses (OpEx)
Fixed costs don't scale with individual sales — you pay them whether you ship 10 orders or 1,000. They belong below contribution margin on an ecommerce P&L.
Shopify subscription: $29–$299/month depending on plan. App subscriptions: Email platform, reviews, upsells, inventory — typically $150–$400/month for a growing store. Salaries and contractors: Customer service, operations, design. Accounting and professional services: Bookkeeper, accountant, legal.
Example: −$3,940 (Shopify $79, apps $260, contractor $2,400, accounting $400, other $801)
Operating Profit (EBIT)
What it is: Contribution margin minus fixed operating expenses. Earnings before interest and tax — the profit from running the core business.
Example: $12,690 − $3,940 = $8,750 (22.3% operating margin)
Net Profit
What it is: Operating profit minus interest expenses and tax obligations. The final bottom line.
Formula: Operating Profit − Interest − Taxes = Net Profit
What to watch: A 50% gross margin sounds great until you subtract 30% in ads and 10% in fees. You're left with 10% net — or nothing. The journey from 65% gross margin to 22% operating margin in our example is normal and healthy — it represents the real cost of running a funded, marketed ecommerce store. A net margin below 10% is thin; 10–20% is solid; above 20% is strong for a store running paid traffic.
Example: $8,750 − $350 (interest) − $2,100 (est. tax) = $6,300 (16.1% net margin)
The Complete Example P&L
| Line item | Amount | Margin |
|---|---|---|
| Gross sales | $43,200 | |
| Less: Returns & discounts | −$4,000 | |
| Net revenue | $39,200 | 100% |
| Cost of goods sold | −$13,720 | |
| Gross profit | $25,480 | 65.0% |
| Shipping & fulfilment | −$4,700 | |
| Payment processing fees | −$1,290 | |
| Ad spend | −$6,800 | |
| Contribution margin | $12,690 | 32.4% |
| Shopify & apps | −$339 | |
| Salaries & contractors | −$2,400 | |
| Accounting & other | −$1,201 | |
| Operating profit | $8,750 | 22.3% |
| Interest & tax | −$2,450 | |
| Net profit | $6,300 | 16.1% |
The Three Margins That Matter
Every line on the P&L traces back to one of three margin metrics. Knowing what each one tells you is how you use the P&L as a decision tool rather than a historical record.
Gross margin (65% in our example) tells you whether your product economics are sound — whether you're pricing correctly and sourcing efficiently. If this is declining, your supplier costs have risen or your pricing is too low.
Contribution margin (32.4%) tells you whether your marketing is profitable — whether ad spend and variable costs are justified by the revenue they generate. If this is compressing, ad efficiency is declining or variable costs are rising faster than revenue.
Net margin (16.1%) tells you whether the whole business is profitable after overhead. If gross and contribution margins are healthy but net margin is thin, fixed costs are too high relative to revenue — a scaling or efficiency problem.
Where Shopify's Analytics Falls Short
A Shopify profit and loss statement summarises revenue, COGS, and operating expenses to arrive at net profit for a closed period. A monthly P&L lands mid-month after close — that's a 15-to-45 day blind spot, depending on when a problem started.
Shopify shows you gross revenue in real time. It does not show you net revenue, gross margin, contribution margin, or net profit. The costs that determine all three — supplier invoices, carrier fees, ad spend, app subscriptions — live outside Shopify in systems that don't talk to each other.
Shopify payouts arrive in the bank as a single net deposit, but the P&L needs the gross sale, the fees, the refunds, and the taxes shown separately. Recording platform payouts as revenue is a common mistake that distorts every margin calculation downstream.
Building a monthly P&L manually requires exporting from Shopify, pulling reports from Meta and Google, compiling carrier invoices, summing app subscriptions, and reconciling everything in a spreadsheet. For a store doing 200 orders a month, this process takes hours and is one formula error away from producing wrong numbers.
The Faster Way to See Your P&L
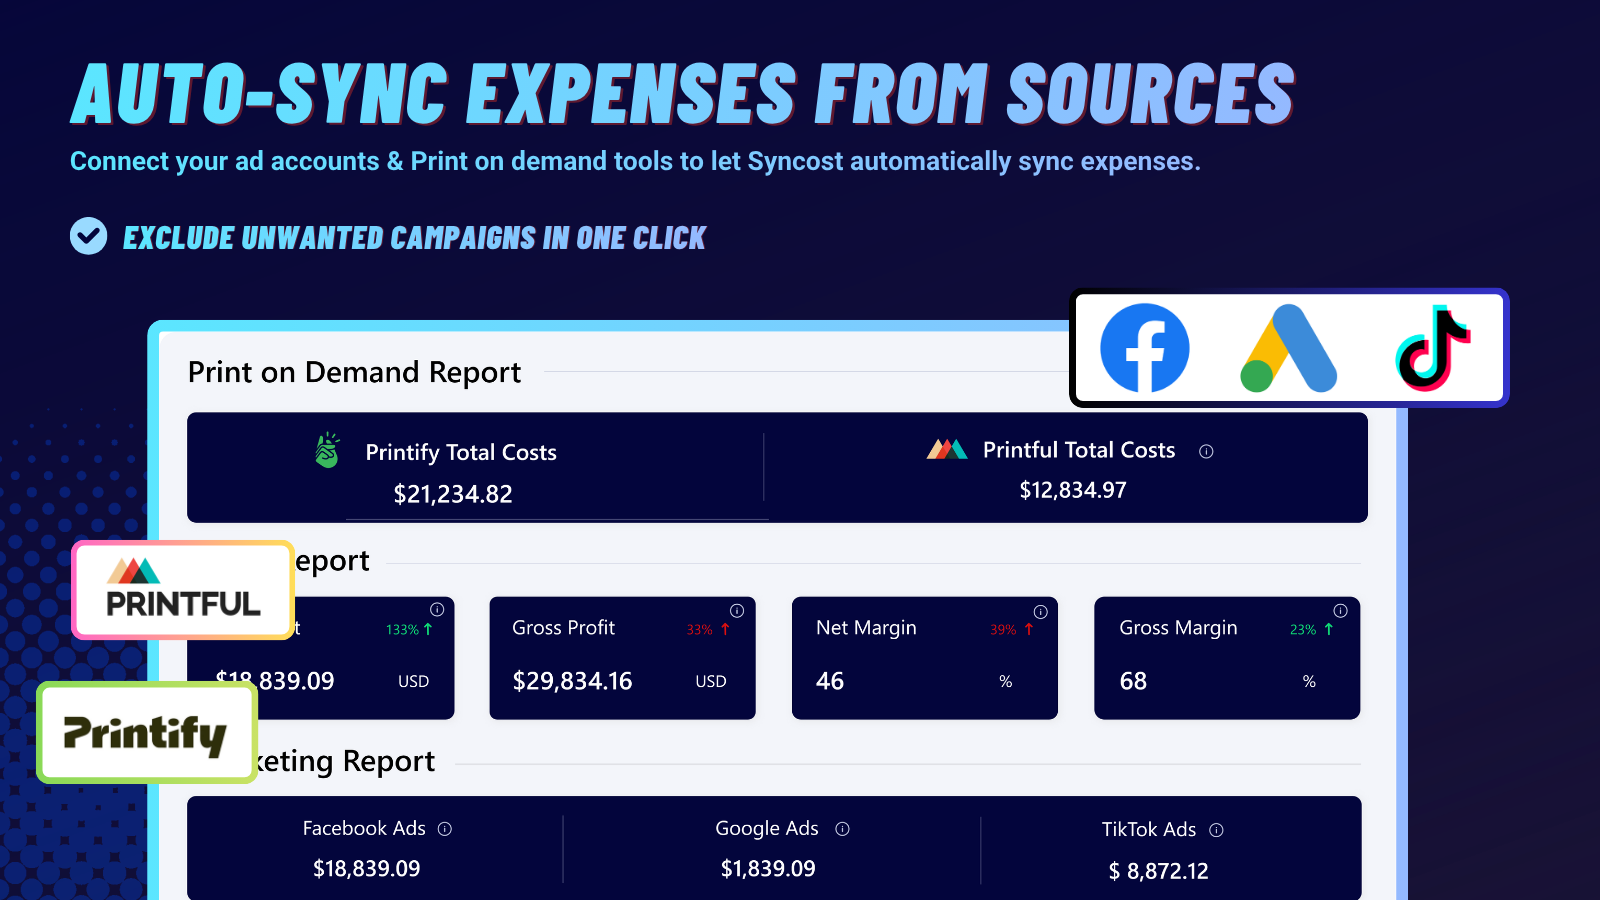
Syncost is built to close this gap for Shopify merchants. It automatically pulls your product costs, Shopify payment fees, shipping, and ad spend together into a per-order and per-period profit view — giving you the contribution margin and net profit picture the P&L above requires, without the monthly spreadsheet marathon. The P&L your accountant needs is still their job. The real-time profit clarity that lets you make decisions before month-end close is what Syncost delivers — so the gap between gross sales and what you actually kept is visible when it matters, not 30 days after the damage is done.
Financial benchmarks reflect 2026 ecommerce industry data from NYU Stern, industry research aggregators, and platform documentation. Margin figures and P&L examples are illustrative. Consult an accountant for business-specific financial reporting.