Revenue Isn't Profit: The Numbers Shopify Doesn't Show You
Revenue is what customers paid you. Profit is what you kept. The gap between them — product costs, processing fees, shipping, app subscriptions, ad spend, returns, chargebacks — lives across six different systems that Shopify's dashboard was never designed to aggregate. Here's what that gap is costing you and why it's wider in 2026 than it's ever been.

There's a particular kind of ecommerce anxiety that hits at the end of a good month. Revenue was up. Orders were strong. The dashboard looked healthy. And yet the bank account doesn't reflect any of it. The money that should be there, isn't — or not as much of it as the numbers suggested it would be.
This isn't bad luck. It's a measurement problem. And it's one of the most common, most expensive, and most invisible problems in ecommerce.
The issue is that the number most merchants track — revenue — is not the number that determines whether a business is healthy. Revenue is what customers paid you. Profit is what you kept after every cost was subtracted. The gap between those two numbers is where most ecommerce businesses either succeed or quietly fail, and it's a gap that Shopify's native analytics — excellent as they are — was never designed to close.
The Dashboard Lie You Tell Yourself Every Morning
Open Shopify. The revenue number is front and centre. Maybe it's $47,000 for the month. Good. Maybe it's up 18% from last month. Better. You feel the momentum. You make decisions based on it — what to restock, which ad campaigns to fund, whether to hire, whether to scale.
But that $47,000 is a gross number. Before the $8,200 you paid your supplier. Before the $3,100 in shipping costs that didn't quite match what you charged customers. Before the $1,350 in Shopify payment processing fees taken before your payout. Before the $890 in app subscriptions that cleared across three different invoices this month. Before the $1,200 in ad spend across Meta and Google. Before the $680 in chargebacks and returns that hit your payout at irregular intervals.
After all of that: $31,580. Not $47,000.
The difference isn't a rounding error. It's 33% of your revenue — and it's hiding in plain sight across six different systems that Shopify's dashboard was never built to aggregate.
Why Shopify Shows You Revenue and Not Profit
This isn't a flaw in Shopify's design. It's a consequence of where Shopify sits in your business architecture. Shopify is your storefront, your order management system, and your payment gateway. It knows what customers paid. It knows what orders were placed. It doesn't know — because it can't know, without being told — what you paid your supplier for each unit, what your carrier actually charged to ship each box, or what you spent on the Meta campaign that brought that customer to your store in the first place.
Those numbers live elsewhere. Supplier costs live in invoices and purchase orders. Shipping costs live in carrier portals. Ad spend lives in Meta Ads Manager, Google Ads, and TikTok. App fees live in individual billing accounts. Chargeback deductions land in Shopify payouts but are disconnected from the original order they relate to.
No single screen in any of these systems shows you what one order — one specific transaction — actually earned you after every cost was accounted for. The revenue your Shopify dashboard shows is accurate. It's just incomplete in the way that matters most.
The Six Cost Layers That Disappear Between Sale and Profit
Product Cost
The supplier invoice is the most obvious cost and the one most merchants track, at least informally. But even here, precision fails most stores. Shopify has a cost-per-item field in the product editor. Many merchants set it once and don't update it when supplier prices change. A 12% price increase from your supplier six months ago that never made it into the cost field means every margin calculation you've run since then has been wrong — overstating profit on every single unit sold.
Payment Processing Fees
Shopify Payments charges 2.9% + 30¢ per transaction on the Basic plan. On a $50 order that's $1.75 — a 3.5% effective rate, not 2.9%, because the flat 30¢ is proportionally larger on lower-value orders. Premium cards (Amex, corporate, rewards) cost more: 3.5% + 30¢. International cards add 1% on top of your standard rate. The blended rate across your actual order mix is almost never the headline number on your plan page.
This matters because Shopify deducts these fees before it pays you out — so they're already gone before the revenue number appears anywhere. You see gross revenue; the fee has already been taken. Most merchants know processing fees exist; almost none know their true blended rate or what it adds up to per order across a month.
Shipping Costs
Most stores build a shipping assumption into their margin model — "it costs us about $5.50 on average." Then they run with that assumption for six months while carrier rates change, order weights shift as product mix evolves, and rural or international addresses cost more than the average assumes. The gap between what you assumed shipping would cost and what it actually cost across 400 orders is rarely zero, and it's never in your favour.
App Subscriptions Spread Across Multiple Invoices
The average Shopify store in its second year pays $200–$400 per month in app subscriptions. Email platform, reviews app, upsell tool, inventory management, analytics. Each one bills separately, on its own cycle, to its own billing method. None of them appear in your Shopify order-level reporting. Spread across 300 orders a month, $300 in app fees adds $1 per order in cost — invisibly, in aggregate, never attributed to any specific sale.
Ad Spend and Customer Acquisition Cost
Ad spend is the largest and most variable cost for most stores running paid traffic, and it exists entirely outside Shopify's ecosystem. Meta Ads Manager knows what you spent and what revenue it claims to have driven. Shopify knows what orders came in and what revenue they generated. Neither tells you what a specific order cost to acquire — the ad spend attributable to that customer — and therefore neither shows you the net margin on that sale.
A 3x ROAS campaign on a product with 30% gross margin generates less gross profit than it costs in ad spend per dollar. That store is losing money on every ad-attributed sale and the Shopify dashboard says nothing about it.
Returns, Chargebacks, and Their Full Cost
Returns show up in Shopify as revenue reversals. What they don't show is the original outbound shipping cost (non-recoverable), the return shipping cost if your policy covers it, the non-refunded processing fee from the original transaction, and the product cost if the item arrives damaged or non-resaleable. A 4% return rate on a $45 product isn't a 4% revenue reduction. It's closer to a 6–8% total impact when every cost component is counted.
Chargebacks are worse. A $45 order that gets charged back costs the merchant the revenue, a $15 platform fee, the processing fee, the product, the shipping, and the customer acquisition cost — often $90–$100 in total losses on a $45 transaction. Shopify shows the chargeback as a payout deduction. It doesn't show the full economic damage.
The Compounding Effect of Not Knowing
These six cost categories aren't exotic. They're the standard operating costs of every ecommerce business. They're not hidden from merchants because anyone is trying to deceive them — they're invisible because they live in different systems that were never designed to talk to each other.
But the business impact of not seeing them is significant and compounding.
Pricing decisions made on incomplete data. If you believe your gross margin is 55% when it's actually 37% after full costs, you price products too low. You run promotions that seemed generous but turn out to be margin-destroying. You offer free shipping thresholds that eat into profit you thought you had.
Scaling decisions made on the wrong metric. The product with the highest revenue isn't always the product with the highest profit. The ad campaign with the best ROAS isn't always the campaign with the best contribution margin. Without profit data at the order and product level, scaling decisions are made by revenue signal — which is correlated with profit, but not the same thing. The store that scales its highest-revenue product when its most profitable product is something else is working against itself.
Cost increases that go unnoticed. Supplier prices drift. Carrier rate cards update. App plans renew at higher rates. Each individual change is small. In aggregate, the cost base that was 42% of revenue eighteen months ago might be 51% today — while the Shopify dashboard shows healthy revenue growth that masks the margin compression happening underneath it.
Cash flow surprises despite profitable-looking months. The most common symptom of the revenue-profit gap isn't a crisis — it's confusion. The month looked good. Revenue was up. Orders were strong. And yet the bank account is tighter than it should be. This is what happens when you run a business on gross revenue signals while actual profit is 20–30% lower and being consumed by costs you're not tracking in aggregate.
What Profit Clarity Actually Changes
The stores that know their true margin on every order make systematically better decisions than the stores that don't. Not dramatically different decisions — just consistently better ones, at every scale.
They know which products to restock, because they can see margin per unit rather than revenue per unit. They know which ad campaigns to fund, because they can see contribution margin per order rather than ROAS. They know when a supplier cost increase has crossed the threshold that requires a price adjustment, because they're watching margin in real time rather than discovering the damage quarterly. They know which sales channels are worth the operational complexity, because they can compare net margin per channel rather than gross revenue per channel.
None of this requires more data. It requires the same data, assembled in one place, at the order level, in real time. That's the gap between a revenue dashboard and a profit dashboard — and in 2026, with ad costs higher than they've ever been and margins tighter across every ecommerce category, that gap is the most important one in your business.
The Numbers Shopify Doesn't Show You Are the Numbers That Matter Most
Revenue tells you what happened. Profit tells you whether what happened was good for the business.
Shopify is the best ecommerce platform available. Its analytics are genuinely useful for understanding customer behaviour, product performance, and traffic quality. But they were built to show you sales data — and sales data is the starting point of profit analysis, not the end point.
The end point is knowing, on every order, what you actually kept. What the product cost. What shipping cost. What the processing fees took. What the ad spend attributable to that customer was. What the return or chargeback on that order added to the cost stack. The sum of all of those costs subtracted from the revenue — that's your profit, and it's the number your business decisions should be built on.
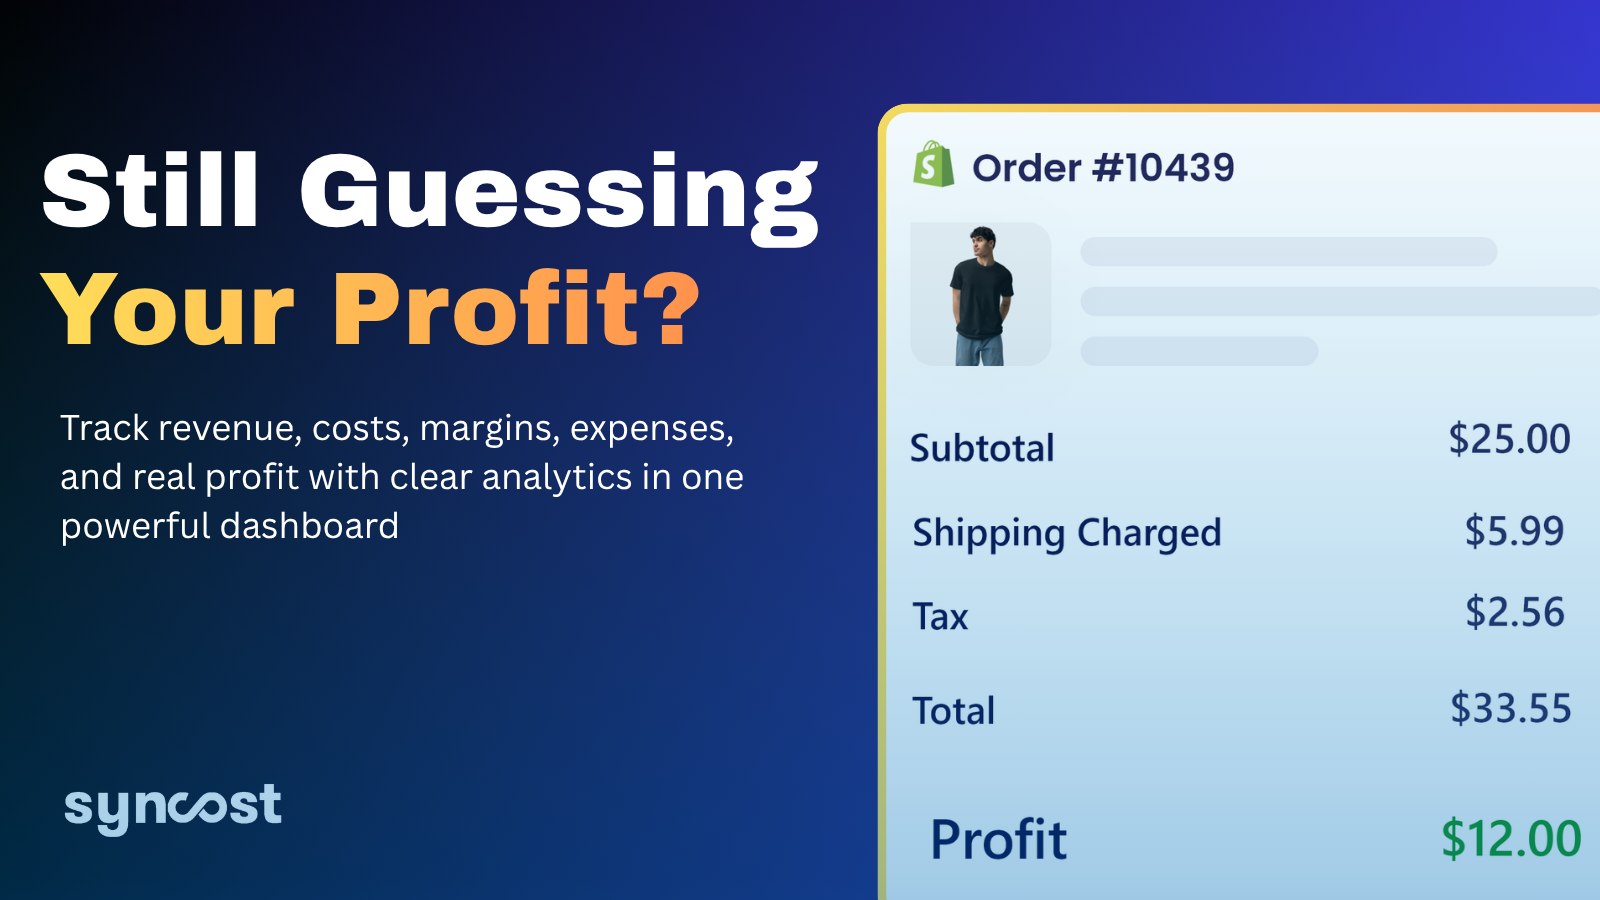
That's what Syncost is built to show you. It connects the cost sources that Shopify can't — product costs, shipping, platform fees, and ad spend — into a single per-order view, so the number you see when you log in isn't revenue. It's profit. Real profit. The money you actually kept.
Because the dashboard that shows you what you made isn't the same as the dashboard that shows you what you kept. And in ecommerce, the distance between those two numbers is where the business lives or dies.
→ See what you're actually keeping at syncost.com
Shopify analytics capabilities and fee structures reflect publicly available 2026 information. Cost estimates and margin examples are illustrative based on representative ecommerce data.