Meta Ads for Dropshippers: How to Stop Losing Money on Testing
Two stores running identical 3x ROAS — one makes $12.71 per order, the other $0.71. ROAS doesn't measure profit; contribution margin does. Here's how to structure Meta ads around the number that actually matters: break-even CAC, minimum viable test budgets, when to kill vs scale, why your reported CPA is probably 20–40% too high, and how to replace ROAS with POAS.

Most dropshippers lose money on Meta ads not because the platform doesn't work — it does — but because they're measuring the wrong thing. They optimise for ROAS, scale when it looks high, cut when it drops, and never calculate whether any of it is actually generating profit. Stores that run at a 2.5x ROAS on a product with a 35% gross margin are losing money on every sale. Stores that run at 1.8x ROAS on a product with 65% gross margin are printing it.
ROAS doesn't care about your costs. Contribution margin does. This guide reframes Meta ad strategy for dropshippers around the one metric that determines whether the business is actually working: does gross profit per order exceed what you spent to acquire that customer?
Why ROAS Misleads Dropshippers
A low-margin dropshipper might require a 5:1 ROAS just to break even, while a luxury brand with high margins might be profitable at 1.5:1. ROAS is relative to your profit margins — the global average of approximately 2.19:1 means nothing in isolation.
Here's the arithmetic that proves it. Two dropshippers, both running a 3x ROAS:
| Seller A | Seller B | |
|---|---|---|
| Sell price | $40 | $40 |
| Supplier cost | $8 | $20 |
| Shipping | $4.50 | $4.50 |
| Shopify fee | $1.46 | $1.46 |
| Gross profit per order | $26.04 | $14.04 |
| Ad spend at 3x ROAS | $13.33 | $13.33 |
| Net profit per order | $12.71 | $0.71 |
Identical ROAS. Identical revenue. One seller makes $12.71 per order; the other makes $0.71 and is one CPM increase away from losing money. The difference is gross margin — and ROAS reveals nothing about it.
ROAS measures revenue relative to spend. POAS — Profit on Ad Spend — measures gross profit relative to spend. POAS is a more accurate metric for scaling because it accounts for product costs, shipping, and operational overhead.
The metric to optimise for isn't ROAS. It's contribution margin per order: gross profit minus customer acquisition cost. If that number is positive, the campaign is worth running. If it's negative, no ROAS figure in Ads Manager changes the fact that you're losing money.
The 2026 Meta Ads Cost Reality for Dropshippers
Before building the testing framework, you need honest benchmarks to plan against.
Meta CPMs increased approximately 20% year-over-year. The all-industry average CPM is $14.19 in 2026, with ecommerce sitting lower at roughly $10–$12. CPC averages $0.78 across all industries; ecommerce runs $0.45–$1.14 depending on vertical and creative quality.
The median CPA across all industries is $38.19 — a 38% increase from 2025's $27.66 baseline. For ecommerce specifically, CPA averages $29.99.
What this means for a dropshipper selling a $35 product: at the ecommerce median CPA of $29.99, you spend nearly as much acquiring the customer as the product costs to buy and sell. On a $35 order with $12 supplier cost and $4.50 shipping, gross profit is roughly $17.18 before rounding — approximately $17. A $29.99 CPA means every order loses $12.99. That's not a testing failure. It's a unit economics problem — the product price isn't high enough to support the channel's customer acquisition cost.
Brands spending under $100/day often see 20–30% higher CPAs than larger spenders due to limited optimisation signals. For new accounts and new products, this means your actual CAC during testing is typically higher than the benchmark — which is exactly why most testing budgets bleed out before the algorithm finds efficient delivery.
Your Break-Even CAC: The Number to Calculate Before You Spend
Before running a single ad, calculate your maximum viable CAC. It's the only number that tells you whether a campaign can be profitable regardless of what ROAS it posts.
Break-even CAC = Gross profit per order − Target net profit per order
On a $50 product:
| Numbers | |
|---|---|
| Sell price | $50.00 |
| Supplier cost | $14.00 |
| Shipping | $5.00 |
| Payment fee (2.9% + 30¢) | $1.75 |
| Gross profit per order | $29.25 |
| Target net profit | $5.00 |
| Break-even CAC | $24.25 |
If your Meta campaigns are producing a $24.25 CPA or below, you're profitable on that product. Above $24.25, you're not — regardless of the ROAS figure in the dashboard.
This number also tells you whether the product is viable for paid traffic at all. If your gross profit per order is $12 and the ecommerce median CPA is $29.99, no amount of creative testing or audience refinement will make the campaign profitable. The product needs a higher price, a lower supplier cost, or a different traffic strategy.
The Minimum Viable Testing Budget
The minimum budget needed to exit Meta's learning phase in one week is approximately (target CPA × 50) ÷ 7 per ad set.
At a $25 target CPA: ($25 × 50) ÷ 7 = $178/day per ad set to exit learning in seven days. Most dropshippers testing at $20–$30/day are spending enough to learn nothing — the algorithm never exits learning phase and delivers inefficient, expensive results indefinitely.
Practical minimum testing budgets by approach:
| Budget | What you can learn | What you can't |
|---|---|---|
| Under $300 total | Almost nothing statistically meaningful | Whether the product converts |
| $300–$700 | Whether a product/creative combination converts at all | Optimal audience, scaling behaviour |
| $700–$1,500 | Whether a product is viable on Meta | Precise CAC at scale |
| $1,500+ | Viable product + enough signal to begin scaling | — |
The right way to think about test budget: it's the cost of information, not the cost of sales. You're buying data that tells you whether a product can be profitable on Meta at your margin. If a $500 test tells you the product can't clear your break-even CAC, that $500 saved you from scaling a $5,000 loser.
Structuring a Test Campaign That Generates Usable Data
Campaign Structure
Advantage+ Shopping Campaigns now represent 62% of ecommerce conversion spend on Meta and deliver 17% lower CPA than manual campaigns for brands with established conversion tracking, diverse creative, and daily budgets above $500.
For new dropshipping products with limited data, start with a manual Sales campaign targeting broad audiences (interest-stacked or age/gender-only) rather than Advantage+ Shopping, which needs conversion history to optimise effectively. Once you have 30+ purchase events on a pixel, switch to Advantage+.
Recommended test structure:
- 1 campaign, purchase objective
- 3–5 ad sets, each testing a different creative angle or audience
- 3–5 ads per ad set — different hooks, formats (static, video, carousel)
- Daily budget: $50–$100 minimum per ad set for meaningful learning
- Let each ad set run 3–5 days before making kill/scale decisions
The Creative-as-Targeting Principle
In 2026, the creative format and copy have become the primary targeting mechanism. Rather than narrow manual targeting, advertisers embed "targeting cues" in creative messaging — allowing the algorithm to find relevant audiences automatically.
A UGC-style video of a pet product that opens with "Every dog owner knows this problem…" targets pet owners through creative, not audience settings. A problem-agitation-solution hook in the first three seconds does more targeting work than any interest stack. This is why broad audiences with specific creative consistently outperform narrow audiences with generic creative in 2026's Meta environment.
When to Kill vs. Scale
The decision rule that prevents testing from becoming money-burning:
Kill after 3–5 days if:
- CPA is more than 2× your break-even CAC with no improving trend
- CTR is below 1% (creative problem, not an audience problem — fix the hook)
- 0 purchases after spending 2× your break-even CAC
Hold and gather more data if:
- CPA is within 30% of break-even CAC and trending down
- CTR is strong (2%+) but conversion rate is weak — a landing page or offer problem
Scale if:
- CPA is below break-even CAC over 7+ days with 10+ purchases
- Increase budget by no more than 20–30% every 3–5 days to avoid triggering the learning phase
Budget increases should not exceed 20% per day to avoid resetting the learning phase.
Attribution: Why Your Reported CAC Is Probably Wrong
iOS attribution gaps mean your actual cost per acquisition is likely 20–40% lower than what Meta reports due to tracking gaps. Factor this in before making drastic budget cuts based on reported data.
Meta's pixel loses iOS conversion data due to Apple's App Tracking Transparency framework. A campaign that appears to be converting at a $45 CPA may actually be converting at $28 — with 35% of purchases simply not reported back to Meta. Stores that cut campaigns because the reported ROAS looked poor are frequently killing profitable activity because their measurement is broken.
The fix is server-side tracking via the Meta Conversions API (CAPI), which sends purchase events from your server directly to Meta, bypassing iOS tracking restrictions. Shopify has a native CAPI integration in the Marketing section of your store settings — enabling it is the single highest-value tracking improvement most Shopify dropshippers haven't made.
With CAPI enabled and browser pixel running together, event match quality improves, reported CPA drops (because more conversions are attributed), and the algorithm trains on better data — typically producing 10–25% better CAC over the following weeks.
POAS: The Metric That Replaces ROAS
Once you have break-even CAC established and attribution clean, replace ROAS as your primary campaign metric with POAS — Profit on Ad Spend.
POAS = Gross profit generated ÷ Ad spend
A campaign generating $5,000 in revenue at $2,000 ad spend posts a 2.5x ROAS. If the gross margin on those sales is 40%, gross profit is $2,000 — a 1.0x POAS. That campaign is breaking even, not profiting.
| POAS | What it means |
|---|---|
| Below 1.0 | Losing money on every sale |
| 1.0 | Breaking even — ad spend equals gross profit |
| 1.2–1.5 | Profitable but thin — vulnerable to cost increases |
| 1.5–2.5 | Healthy — worth scaling |
| Above 2.5 | Strong — prioritise budget allocation here |
POAS requires knowing your gross profit per order, which means knowing your product cost, shipping, and platform fees accurately — not estimated. That's the link between Meta ad strategy and the profit tracking that makes it actionable.
Know Your True CAC on Every Order
Your Meta Ads Manager shows you CPA — what Meta thinks each conversion cost. It doesn't show you what that order actually earned after your supplier cost, Shopify fees, shipping, and the percentage of orders that were returned. The gap between reported CPA and true net profit per order is where most dropshipping ad budgets disappear.
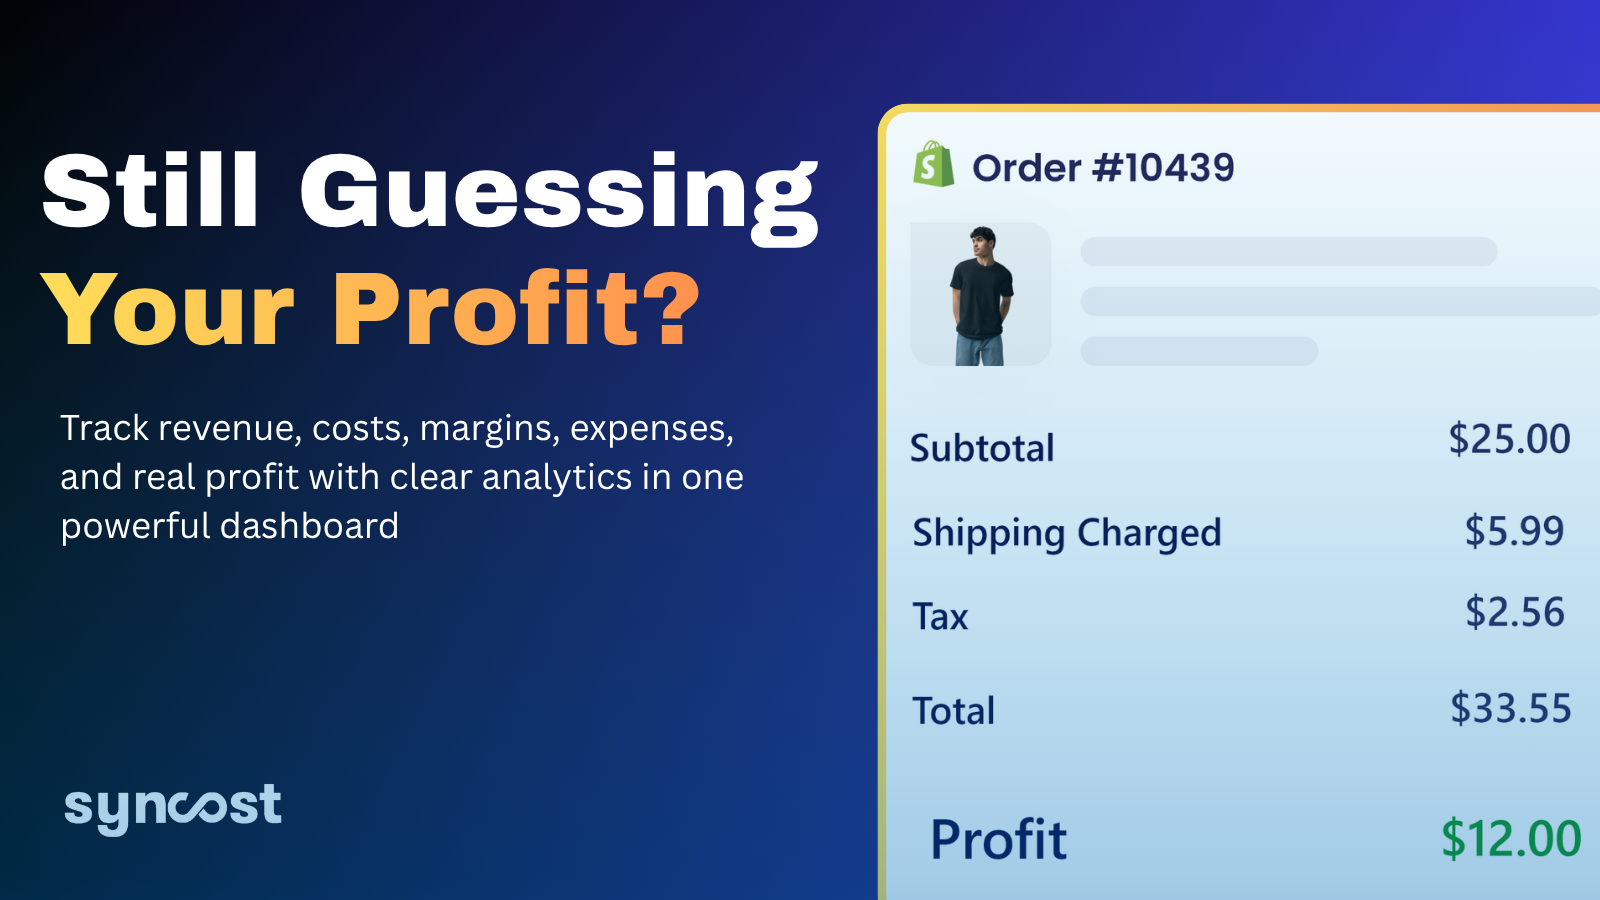
That's exactly what Syncost closes for Shopify merchants. It combines your product costs, Shopify fees, and shipping with your actual ad spend to show true net profit per order — not the revenue number in Shopify and not the CPA number in Meta, but the real net margin on each sale after every cost. When you can see that number on every order, the decision of which campaigns to scale, which products to keep running, and which ads are actually contributing to your business becomes a data question rather than a gut-feel one. That's how you stop losing money on testing — not by spending less, but by knowing exactly what each dollar spent is really worth.
Meta ad cost benchmarks reflect published 2026 data from Ryze AI, Triple Whale, MHI Growth Engine, and Mako Metrics. CPA, CPM, and ROAS figures vary by vertical, creative quality, budget size, and account maturity. Verify against your own account data before making budget decisions.