The Hidden Costs of Ecommerce: The Silent Profit Leaks Most Sellers Never Find
Revenue tells you how much you sold. Profit tells you whether the business is working. This is the definitive guide to ecommerce's seven hidden cost categories — payment processing gaps, app subscription creep, supplier cost drift, shipping assumption errors, returns, chargebacks, and untracked time — and why none of them show up on your Shopify dashboard.
Revenue is the number everyone watches. It's on the dashboard when you log in, it's what you report to your accountant, it's the figure you mention when someone asks how the store is doing. Revenue feels like the score.
It isn't. Profit is the score — and in ecommerce, profit is determined less by how much you sell than by how much quietly leaks out between the sale and your bank account. Most of that leakage is invisible. It doesn't appear on a single report. It doesn't send an alert. It compounds silently across every order until a store that looks healthy on revenue turns out to be running on margins so thin that one bad month tips it into loss.
This is the definitive guide to ecommerce hidden costs: what they are, where they hide, and how to find them before they find you.
Why Ecommerce Profit Is Harder to See Than It Should Be
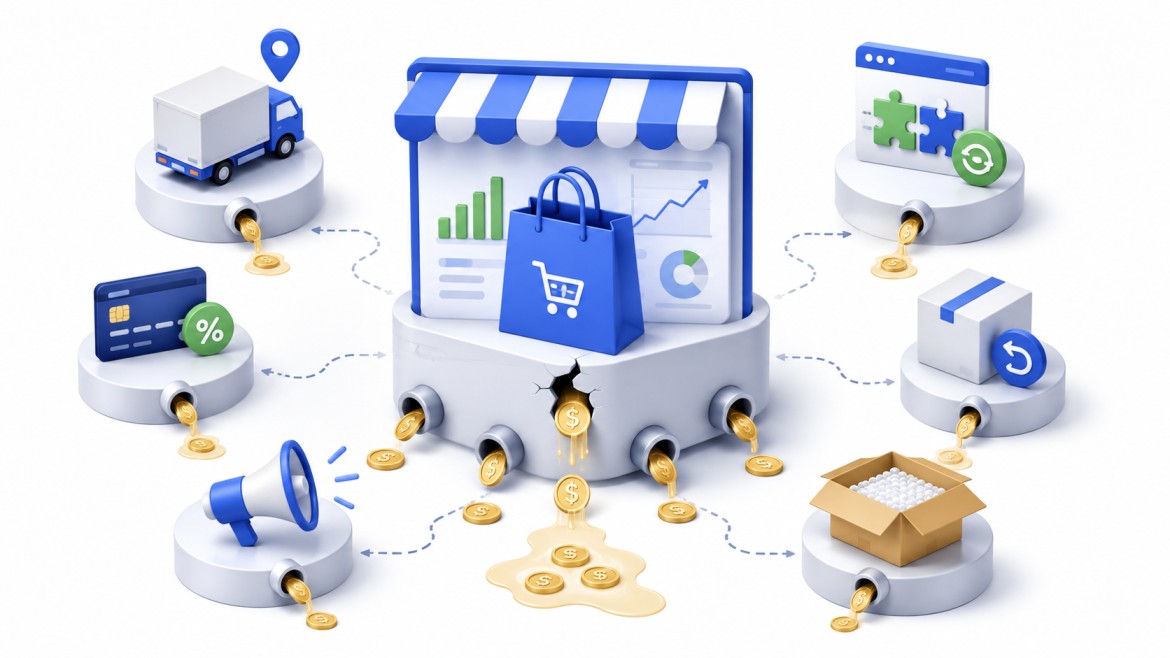
A retail store has one register. An ecommerce store has at least six: Shopify for revenue, the payment processor for fees, the ad platform for spend, the supplier system for product costs, the shipping carrier for fulfilment, and app billing for subscriptions. Each captures a different slice of the cost structure. None of them talk to each other. None of them show you what an individual order actually earned.
The result is a merchant who knows their revenue to the dollar and their costs to a rough approximation. That gap between knowing and approximating is where profit disappears.
The Seven Hidden Cost Categories
1. Payment Processing Fees You're Not Modelling Per Order
Every Shopify merchant knows they pay processing fees. Most think of them as a monthly line — "we spent about $800 on fees last month." Almost none model them per order, which is where the real insight lives.
On Shopify Basic with Shopify Payments, the standard rate is 2.9% + 30¢ per transaction. On a $30 order, that's $1.17 — a 3.9% effective rate, not 2.9%, because the 30¢ flat fee is proportionally larger on low-value orders. On a $150 order, the effective rate drops to 3.1%. The blended rate across your order mix is almost never the headline percentage — and if you're modelling margin at the headline rate, you're overstating profit on every small order.
Two surcharges make this worse without most merchants realising it:
Premium card surcharge. American Express, corporate, and rewards cards carry a higher processing rate — 3.5% + 30¢ on Basic, compared to 2.9% + 30¢ for standard cards. If 20–30% of your customers pay with Amex or corporate cards, your real blended processing rate is meaningfully higher than you think.
International card surcharge. Cards issued outside your country add 1% on top of the standard rate across all Shopify plan tiers. A store with 25% international traffic and a headline processing rate of 2.9% is actually paying 3.9% on a quarter of its transactions.
The fix is simple: check your actual blended processing rate in Shopify Payments, not the plan rate. The difference is often 0.3–0.7% — small per order, meaningful at volume.
2. Platform and App Fees Treated as Fixed When They're Per-Order Costs
The monthly Shopify subscription is a fixed cost: $29 on Basic, $79 on Grow, $299 on Advanced (annual billing). Most merchants record it as overhead and move on. What they don't do is divide it by monthly order count to see what it adds to each sale.
At 50 orders a month, a $29 Basic subscription adds $0.58 per order. At 500 orders, it's $0.06. The plan cost per order is a variable that matters most at low volume — and it's the reason upgrading to a paid plan is often margin-negative at low order counts even when the processing rate savings look attractive.
The same logic applies to every app subscription. A $49/month email app divided by 200 orders adds $0.25 to every sale. At 20 orders it adds $2.45. Apps that feel like flat overhead are actually per-order costs once you spread them across your volume — and most stores carry 3–8 paid apps without ever running this calculation.
The average Shopify store in its second year pays $200–$400/month in app subscriptions. At 200 orders a month, that's $1–$2 per order in hidden app cost on top of every other fee. At 50 orders, it's $4–$8.
3. Supplier Costs That Drift Without Triggering an Alert
Your supplier quoted you $8.50 per unit six months ago. Your product is still priced for a $8.50 unit cost. But your supplier silently raised their price to $9.75 three months ago — a 14.7% increase that you absorbed without updating your pricing model because no system connected the supplier invoice to the product's margin calculation.
This is one of the most common hidden cost patterns in ecommerce, and it's structurally guaranteed to happen in any business where supplier costs and product pricing live in different systems.
The drift compounds. A 14.7% unit cost increase on a product with a 40% gross margin doesn't reduce margin by 14.7% — it reduces it by more, because the cost increase applies to the full base cost while the margin is calculated on revenue. On a $30 product with an $8.50 cost (28.3% of revenue), a $1.25 cost increase cuts gross margin from 40% to 35.8% — a 4.2-point margin hit from a cost change that may never have been deliberately noticed.
4. Shipping Costs That Don't Match Your Assumptions
Most merchants build a shipping assumption into their pricing: "we'll charge $5.99 for shipping and it costs us about $4.50, so we make $1.49 per shipment" or "we offer free shipping and it costs us $4.50 per order on average." Then they run with that assumption for six months without checking whether it's still accurate.
It usually isn't. Carrier rates change. Order weights change as product mix shifts. Customers in Alaska or Hawaii or rural addresses cost more to ship to. International orders can cost two to three times the domestic baseline. And dimensional weight pricing means a bulky but light product costs far more to ship than its actual weight suggests.
The result: stores that modelled $4.50 shipping six months ago are often paying $5.80 now — a $1.30 per-order leakage that hits every single fulfilment and appears nowhere in the revenue dashboard.
5. Returns, Refunds, and the Full Cost of a Lost Sale
A return isn't just a revenue reversal. It's a revenue reversal plus the original shipping cost (non-recoverable) plus the return shipping cost (if your policy covers it) plus the non-refunded payment processing fee plus the product restocking or write-off if the item can't be resold.
On a $45 order, a processed return where the product comes back in resaleable condition costs roughly $6–$10 in fees and shipping that don't come back. A return where the product is damaged costs $20–$30. A "keep the item" resolution costs the full product cost and shipping.
At a 4% return rate on 300 orders a month at $45 average order value, you're processing 12 returns a month. If the average true cost of each return is $15, that's $180/month in hidden return cost — more than half a Shopify Basic subscription in pure waste.
Chargebacks are more expensive still. On the same $45 order, a lost chargeback costs you the sale, a $15 platform fee, the non-refunded processing fee, the product, the shipping, and the customer acquisition cost — often $90–$100 in total losses on a $45 transaction. A 2% chargeback rate on 300 monthly orders generates 6 disputes a month and $540–$600 in total losses that show on no single report.
6. Customer Acquisition Cost Applied to Every Order
Paid advertising costs are the most obvious ecommerce expense — and still the most commonly misapplied one. Most merchants track total ad spend and total revenue separately, then calculate a blended ROAS. What they don't do is apply the customer acquisition cost to each order's profit calculation.
The problem with ROAS as a metric is that it measures revenue return on ad spend, not profit return. A 3x ROAS sounds healthy. On a product with 35% gross margin, a 3x ROAS means you're spending $1 in ads for every $3 in revenue, recovering $1.05 in gross profit per ad dollar spent — a thin 5% net margin before any other costs. Apply platform fees, shipping, and apps, and many "3x ROAS" campaigns are losing money per order.
The correct calculation is: does gross profit per order exceed customer acquisition cost? If your CAC is $12 and your gross profit per order is $11, no ROAS figure makes that campaign profitable. This is the calculation that reveals which ad campaigns are actually making money — and in most stores, it disqualifies 20–40% of running campaigns that look healthy on a ROAS dashboard.
7. The Cost of Time That Never Gets Counted
Every hour spent on customer service for a late delivery is a cost. Every hour rebuilding a monthly export spreadsheet, processing returns manually, or chasing supplier invoices is a cost. These hours don't appear on any P&L, but their opportunity cost — against what you'd be doing if operational drag didn't consume them — is often the largest hidden cost in the business.
Stores that over-invest in revenue-generating activity relative to administrative drag grow. Stores that spend half their operating time on administration grow slowly — and the difference often isn't visible until you try to scale and realise the model breaks under volume.
What These Hidden Costs Add Up To: A Real Example
Let's run the full hidden cost stack on a store doing 300 orders a month at a $45 average order value ($13,500/month in revenue) on Shopify Basic:
| Hidden cost category | Monthly amount | Per-order impact |
|---|---|---|
| Processing fee gap (blended vs modelled) | ~$90 | $0.30/order |
| App subscriptions (÷ 300 orders) | ~$240 | $0.80/order |
| Supplier cost drift (est. 5% underestimate) | ~$180 | $0.60/order |
| Shipping assumption gap (est. $0.80/order over) | ~$240 | $0.80/order |
| Returns (4% rate, $15 avg true cost) | ~$180 | $0.60/order |
| Chargebacks (1.5% rate, $90 avg total cost) | ~$405 | $1.35/order |
| Total hidden cost | ~$1,335/month | ~$4.45/order |
On $13,500 in revenue, $1,335 in hidden costs represents nearly 10% of revenue quietly not arriving. If that store was modelling a 30% net margin, the real margin is closer to 20%. If it was modelling 15%, the real margin might be 5% — or loss.
These aren't unusual numbers. They're the realistic hidden cost stack of a mid-stage Shopify store that doesn't track per-order costs in detail. Every cost in the table above is well-documented, common, and predictable. None of it appears in the Shopify revenue dashboard.
The Common Thread: Costs That Live in Different Places
The reason hidden costs stay hidden in ecommerce isn't that they're obscure or exceptional. It's structural. Every cost category above lives in a different system:
- Revenue → Shopify dashboard
- Processing fees → Shopify Payments or processor statement
- Supplier costs → supplier invoices or procurement system
- Shipping → carrier accounts (UPS, FedEx, Royal Mail)
- Apps → individual app billing, often on separate invoices
- Ad spend → Meta, Google, TikTok ad platforms
- Returns and chargebacks → Shopify payout deductions, spread across days
No single screen in any of these systems shows you what an individual order actually earned after every cost is accounted for. The merchant who can see that is running a fundamentally different business from the one who can't — because you can only optimise what you can measure, and you can only measure what's in one place.
The Real Cost of Not Knowing
Hidden costs are not a cosmetic problem. They're a decision problem. Every pricing decision, every scaling decision, every channel investment, every supplier choice is made on the basis of what the margin looks like. If the margin you think you see is 30% but the margin you're actually earning is 20%, you're:
- Pricing products too low, because you think you have more room than you do
- Scaling ad spend on campaigns that appear profitable but aren't
- Keeping supplier relationships that are gradually eroding your margin with cost drift you haven't noticed
- Missing the moment when a product category stopped being worth selling
None of these errors are dramatic. They don't announce themselves. They compound quietly until the revenue that looked like growth turns out to have funded a lot of cost growth too — and the margin was eaten along the way.
Know Your Real Costs on Every Order
The seven hidden cost categories in this guide all share one characteristic: they're real, they're predictable, and they're findable — once you have a way to see them in one place rather than across six disconnected systems.
That's exactly what Syncost is built to do for Shopify merchants. It automatically pulls together your product costs, Shopify fees, shipping, and ad spend into a single view on every order — so instead of approximating your margin from revenue minus a few known costs, you see the true net profit each order actually generated. When supplier costs drift, it shows up in your margin before you've lost three months of profit to the gap. When a campaign's real CAC exceeds its real gross profit, you see it in the order data, not six weeks later in a spreadsheet reconciliation. When chargebacks are costing you $90 per incident rather than the $45 you're mentally tracking, the true cost is visible — and preventable.
Revenue tells you how much you sold. Profit tells you whether the business is working. Syncost is the tool that closes the gap between the two — and turns ecommerce's most persistent problem from a hidden cost into a known, managed, optimisable number.
Cost estimates and ranges are illustrative based on representative 2026 ecommerce data. Actual figures vary by store volume, product category, supplier, payment processor, and market. Verify your own cost structure for accurate margin calculations.