Shopify Analytics: What It Shows You (and the Profit Data It Hides}
Shopify analytics is excellent at what it does sessions, conversion rates, revenue by product and channel. What it doesn't show is what any of those sales actually cost you. Here's exactly what's missing: gross margin accuracy, per-order processing fees, ad spend attribution, contribution margin, and net profit — and why the revenue ranking and profit ranking of your products are often opposite lists.

Shopify's analytics dashboard is genuinely well-built. It's clear, fast, and accurate for what it does. Sessions, conversion rates, top products by revenue, traffic sources, customer geography — all of it is well-presented and updated in real time. For understanding how customers are finding and using your store, Shopify analytics does the job.
The problem is that running a profitable store requires knowing more than how customers behave. It requires knowing what each order actually costs and earns. And Shopify's analytics — excellent as they are — were built to answer the customer behaviour question, not the profitability question. The gap between what they show and what you need to make sound business decisions is where most Shopify merchants run blind.
This article maps exactly what Shopify analytics covers, what it doesn't, and what you need to fill the gap.
What Shopify Analytics Does Well
Before the gaps, the genuine strengths — because Shopify analytics earns its place in any merchant's workflow.
Real-Time Overview
The live dashboard shows current sessions, current sales, and recent orders in real time. For spotting whether a campaign just sent traffic, whether a product launch is converting, or whether the store is behaving normally on a busy day, this view is exactly what you need.
Sales and Revenue Reporting
Total sales, orders, average order value, and revenue broken down by product, collection, channel, and time period — all accurate and exportable. If you want to know which products sold most last Tuesday or how revenue compares to the same period last year, Shopify gives you a clean answer.
Traffic and Conversion Analysis
Sessions by traffic source, conversion rate by channel, top landing pages, and customer bounce rates. Shopify connects where visitors came from to whether they converted — which is the foundational analysis for evaluating whether any given marketing channel is worth running.
Customer Reports
New versus returning customers, customer cohort retention, geographic distribution, and lifetime value estimates. These are useful for understanding your audience composition and how well you're retaining customers over time.
Inventory Reporting (Advanced and Plus)
Stock levels, sell-through rates, and inventory forecasting are available on higher plans. For stores managing meaningful inventory, these reports reduce stockout and overstock risk.
All of this is real value. The issue isn't that Shopify analytics is bad. It's that it's incomplete in a specific, consequential way.
What Shopify Analytics Doesn't Show You
Your Real Gross Margin
Shopify has a gross margin report on Advanced and Plus plans, powered by the cost-per-item fields you enter on each product variant. This sounds useful — and it is, in theory. In practice, it fails in two critical ways.
Static cost fields. The cost-per-item field is something you enter manually. If your supplier raised their price three months ago and you didn't update the field, every gross margin figure Shopify shows you since that change is overstated. The report looks right; the number is wrong. There's no alert when supplier invoices diverge from what's in the system.
Incomplete cost capture. Even a perfectly updated cost-per-item field doesn't include outbound shipping costs (what you paid your carrier per order), which vary by destination, weight, and dimensional size. It doesn't include the blended payment processing rate, which varies by card type and plan. Shopify's "gross margin" is revenue minus the supplier cost field — not revenue minus the full cost of fulfilling the order. That's a meaningful difference on almost every transaction.
Your Actual Payment Processing Cost
Shopify Payments takes 2.4–2.9% + $0.30 per transaction. On a $10,000 month, that's $300+ in fees. Shopify shows you processing fees in payout reports, but never connects them to individual orders or products in the analytics layer. You can see total fees paid this month; you can't see the contribution of processing fees to the margin on your top product.
The blended rate problem makes this worse. Standard cards run at your plan rate. Amex and corporate cards run at the premium rate (up to 3.5% + 30¢ on Basic). International cards add 1% on top of the standard rate. Your real blended processing rate across your order mix is almost never the headline number — but Shopify analytics doesn't show it, and product margin reports don't account for it.
Your True Ad Spend Per Order
This is the most significant gap in Shopify analytics. Shopify knows what revenue each order generated. Meta Ads Manager knows what you spent on the campaign that might have driven that order. Neither system connects those two numbers at the order level — and Shopify analytics has no way to import your ad spend and attribute it to specific orders.
The result: Shopify shows you revenue by traffic source (organic, paid social, email, direct), but it doesn't show you the cost of generating that revenue on any channel. You can see that paid social generated $12,000 in revenue this month. You can't see that you spent $8,000 to generate it — unless you calculate it manually from a separate ad platform dashboard. And you certainly can't see it broken down by product, so you'd know whether your bestselling product on paid social is actually profitable after ad spend is attributed.
Contribution Margin and Net Profit
This flows from the above. Shopify analytics shows gross revenue. It shows estimated gross margin if your cost fields are current. It does not show contribution margin (gross profit minus CAC), operating profit (after platform and app fees), or net profit (after everything). The metric that determines whether the business is healthy — what you actually keep — is not available anywhere in Shopify's analytics, regardless of plan.
Per-Order Profitability
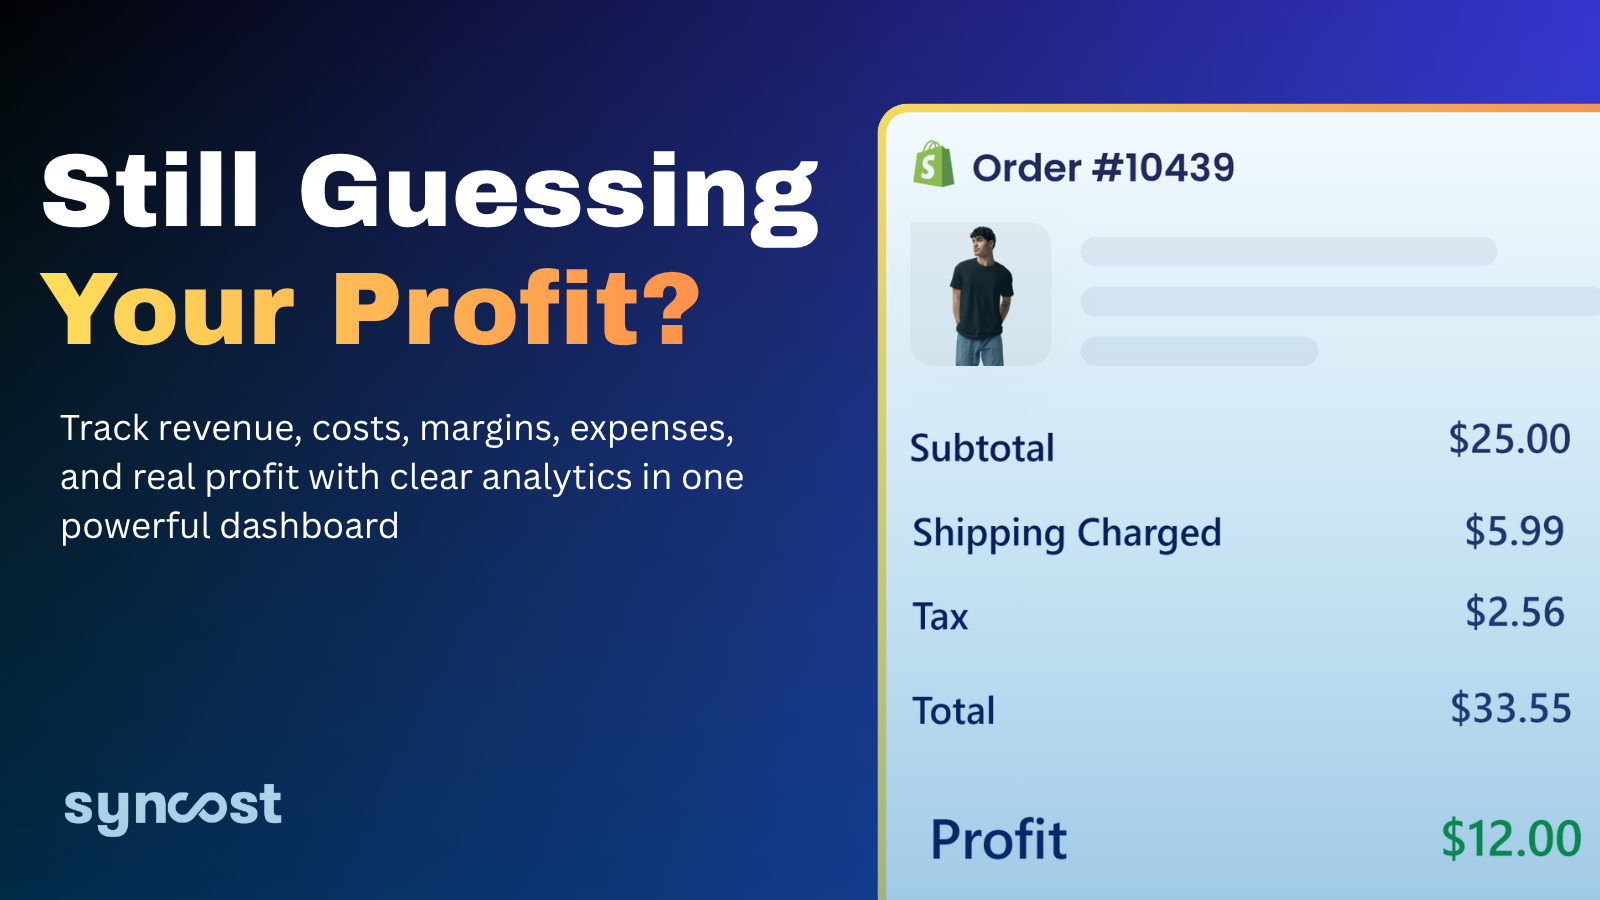
Even on Advanced and Plus, Shopify doesn't give you a profit figure on any individual order. You can see the order value, the products, the shipping charged, and the customer. You cannot see what that order cost to fulfil (including shipping paid), what the payment processing fee was on that specific transaction, or whether the customer who placed it came through a campaign that makes them profitable or not.
This matters most for decisions about which products to promote, which channels to invest in, and which customers to prioritise. All of those decisions should be made on profit data. Shopify analytics only shows you the revenue side.
Chargeback and Return Cost Tracking
Chargebacks appear in Shopify as payout deductions — a negative line item in the payout that reduces what you receive. Returns appear as revenue reversals in the orders report. Neither shows the full cost of the event: the chargeback fee ($15 on Shopify Payments in the US), the non-refunded processing fee, the product cost on a return that can't be resold, or the original outbound shipping that's never recovered.
The P&L aggregates by design. It doesn't show which SKU is driving 60% of the returns, or that returns spiked on orders from a specific campaign, until someone manually cuts the data. Shopify analytics is even less granular than a P&L on this — it shows total refunds as a summary number, not the cost components of each return event.
Fixed Cost Impact on Per-Order Economics
Your Shopify subscription, app fees, and any other fixed monthly costs affect your net margin on every order — but they're invisible in analytics. A store doing 50 orders a month at a $29 Shopify subscription pays $0.58 per order in subscription overhead. At 500 orders, it's $0.06. This cost per order matters for accurate margin modelling, but it appears nowhere in Shopify's analytics at the order or product level.
The Analytics Gap in Practice
Here's what the gap looks like in a real scenario. A store is reviewing its top five products by revenue in Shopify analytics:
| Product | Monthly revenue | Orders | Revenue rank |
|---|---|---|---|
| Product A | $8,200 | 182 | #1 |
| Product B | $6,100 | 203 | #2 |
| Product C | $5,400 | 108 | #3 |
| Product D | $4,800 | 160 | #4 |
| Product E | $3,600 | 90 | #5 |
Based on Shopify analytics, the obvious decision is to promote Product A and B hardest — they're generating the most revenue.
Now add the profit data Shopify doesn't show:
| Product | Monthly revenue | Gross margin | Paid CAC | Monthly GP | Revenue rank | Profit rank |
|---|---|---|---|---|---|---|
| Product A | $8,200 | 28% | $18 | −$980 | #1 | #5 (losing money) |
| Product B | $6,100 | 42% | $9 | $735 | #2 | #3 |
| Product C | $5,400 | 61% | $0 (organic) | $3,294 | #3 | #1 |
| Product D | $4,800 | 35% | $12 | −$240 | #4 | #4 (losing money) |
| Product E | $3,600 | 55% | $4 | $1,620 | #5 | #2 |
Product A, the revenue leader, is losing $980/month after paid acquisition cost on 28% gross margin. Product D is also loss-making. The two highest-profit products are Product C (pure organic traffic, 61% gross margin, $3,294/month gross profit) and Product E (low CAC, 55% gross margin, $1,620/month).
Without the profit data, the natural decision is to scale A and B. With it, the decision is to scale C and E, fix the economics on B, and stop promoting A and D on paid channels entirely. That's a fundamentally different allocation of budget and energy — and it's invisible in Shopify analytics.
What Fills the Gap
Three types of tools address the Shopify analytics profit gap, each at a different level:
Accounting software (QuickBooks, Xero + A2X): Produces accurate monthly P&L statements by pulling Shopify transaction data, ad platform invoices, and supplier costs into a properly structured chart of accounts. Excellent for compliance, tax, and period-end reporting. Not designed for real-time, per-order visibility — by the time the monthly close is complete, decisions based on that data are already being made on the next month's performance.
Ad attribution tools (Triple Whale, Northbeam, Elevar): Connect ad platform spend to Shopify orders using first-party attribution, addressing the iOS tracking gap and giving you revenue-per-campaign data more accurately than Meta or Google's native reporting. Useful for marketing decisions; don't account for COGS, shipping, or non-advertising costs.
Profit analytics tools (Syncost): Pull together product costs, Shopify fees, shipping, and ad spend into a per-order and per-period profit view — showing the contribution margin, gross profit, and net profit that Shopify analytics doesn't. The right tool for the specific gap this article describes: knowing what each order earns, in real time, after every cost.
The Right Way to Use Shopify Analytics
Shopify analytics is a traffic and behaviour tool, not a profitability tool. Use it for what it's good at:
- Traffic analysis: Where are customers coming from, and are those channels growing?
- Conversion optimisation: Which pages convert well, and which have drop-off?
- Product and collection performance: What's selling, in what quantities, through which channels?
- Customer behaviour: Are customers returning? How do cohorts retain over time?
For every profitability question — gross margin, contribution margin, net profit per order, ad-spend-attributed profit by product — you need data from outside Shopify connected to the order-level data inside it.
That connection is exactly what Syncost makes for Shopify merchants. It doesn't replace Shopify analytics — it completes it. Shopify tells you what happened in your store. Syncost tells you whether what happened was profitable, per order, per product, and per channel, in real time. Together, they answer the question Shopify analytics alone never can: not just how much did we sell, but how much did we keep?
Shopify analytics features and plan availability reflect publicly available 2026 information. Feature sets vary by plan and are subject to change. Verify current capabilities at help.shopify.com.