How to Increase Profit Margin in Your Online Store (Without Raising Prices)

Raising prices is the fastest way to improve margin. It's also the tactic most sellers avoid — worrying about conversion rate drops, competitive positioning, and customer reaction. So the real question becomes: what else can you do?
The answer is more extensive than most sellers realise. Your profit margin is the product of revenue minus every cost. Raise prices and you've moved the revenue side. But every cost below the revenue line is a lever you can pull without changing what customers pay. Supplier negotiations, shipping optimisation, fee structure, product mix, and ad efficiency all directly move margin — often by more than a modest price increase would.
This guide works through each lever with specific, actionable moves ranked by how much margin they're likely to recover. The constraint throughout is the one in the brief: no price increases.
Why Margin Improvement Starts With Knowing Which Cost Is Wrong
Before tactics, the diagnostic. Most sellers who want to improve margin don't actually know which part of their cost structure is the problem. They feel squeezed — the revenue looks right, the expenses seem normal — but the bank account doesn't reflect it.
The reason is almost always one (or more) of six costs that drift without triggering an obvious alert:
- Supplier cost crept up and the product cost field in Shopify wasn't updated
- Blended processing rate is higher than expected because of premium or international cards
- Shipping cost diverged from the estimate because of dimensional weight or surcharges
- Ad CPAs rose over the quarter as competition increased
- Return rate climbed on a product category, adding invisible cost to every affected order
- App subscriptions accumulated and are now $300+/month in overhead that was never formally budgeted
You can't improve what you can't locate. The first move in any margin improvement programme is building the visibility to see which cost is dragging — not guessing at it from a revenue dashboard.
Lever 1 — Negotiate Supplier Costs
Potential margin improvement: 3–8 percentage points
Your supplier cost is the single largest cost in most ecommerce orders, and it's also the most negotiable cost most sellers never negotiate. Three levers move it.
Volume Commitments
Suppliers price per unit lower when they can plan larger production runs or commit to higher inventory movement. If you're currently ordering 100 units at a time and can credibly commit to 300, the conversation about unit price becomes legitimate. You don't need to increase current order frequency — a written commitment to a minimum annual volume, backed by your recent sales data, is often enough to unlock a meaningful discount.
At a $10 current supplier cost, a 10% negotiated reduction to $9 saves $1 per unit. At 500 units a month, that's $500/month in recovered margin — $6,000/year from a single conversation.
Second Supplier Benchmarking
Get a competing quote. You don't have to switch suppliers — but having a specific competing price from a credible alternative gives you negotiating leverage you otherwise don't have. Most suppliers have more flexibility than they show on the first invoice. A competing quote at $8.50 on a product you currently pay $10 for isn't necessarily a supplier you'll use — it's a data point that opens the conversation.
Product Specification Review
Sometimes the unit cost is high because the specification includes something customers don't value. A packaging upgrade, a premium label stock, or a product variant that's only marginally different from a lower-cost option can carry significant cost without equivalent customer-perceived value. Review your cost structure line by line with your supplier and ask what the same product costs without each element. Sometimes the answer moves the cost more than any negotiation does.
Lever 2 — Reduce the Blended Processing Rate
Potential margin improvement: 0.3–1.5 percentage points
Your payment processing rate is set by your Shopify plan, but your actual blended rate is higher — sometimes significantly — because of the card mix your customers use.
Switch to Shopify Payments
If you're still on a third-party gateway, the 2% extra transaction fee on Basic costs you $2 for every $100 in sales. On $15,000/month in revenue, that's $300/month — more than the monthly subscription upgrade to Grow. Switch to Shopify Payments and the third-party fee disappears entirely. This is the highest-ROI processing change available and it takes an afternoon.
Upgrade Your Shopify Plan at the Right Volume
Shopify Basic charges 2.9% + 30¢. Shopify Grow charges 2.7% + 30¢. The plan upgrade costs $50/month extra on annual billing. The rate reduction saves $0.10 per order. At 500+ orders/month, upgrading to Grow saves money net of the subscription increase. The crossover is approximately $25,000/month in revenue — above that, Grow is cheaper in total platform cost than Basic.
Audit Your Premium and International Card Mix
Amex and corporate cards cost 3.5% + 30¢ on Basic — 0.6 percentage points more than standard cards. International cards add 1% on top of any rate. If 25% of your volume runs on premium or international cards, your effective blended rate is meaningfully higher than your plan rate. You can't change what cards customers use — but knowing your real blended rate means your margin model reflects reality rather than the headline number.
Lever 3 — Optimise Shipping Costs
Potential margin improvement: 1–3 percentage points
Shipping is one of the most recoverable cost categories because it's influenced by choices you make — carrier, service level, packaging dimensions, and negotiated rates — not just market forces.
Audit Dimensional Weight Pricing
Most carriers price based on dimensional weight (package volume divided by a divisor) rather than actual weight when the package is large and light. A product that weighs 200g but ships in an oversized box may be billed at the dimensional weight of a 1kg package. Switching to right-sized packaging — boxes that fit the product closely — can reduce per-order shipping cost by $1–$3 on affected items. For a store with 300 such shipments a month, that's $300–$900 in recoverable shipping cost from a packaging change.
Negotiate Carrier Rates at Volume
UPS, FedEx, and DHL offer negotiated rate discounts starting at relatively low monthly volume — often 100–200 shipments/month. Most sellers on Shopify Shipping receive Shopify's pre-negotiated discounts by default, which are solid for low volume. At higher volume, a direct carrier account negotiation based on your actual monthly shipping data typically produces better rates than any aggregator's standard discount.
Review Your Free Shipping Threshold
If you offer free shipping on all orders, you're absorbing shipping on your lowest-margin orders as well as your highest. A free shipping threshold set above your breakeven point — where the incremental product margin on orders above the threshold covers the shipping cost you're absorbing — improves margin on the order mix without eliminating the free shipping offer. Evaluate your current threshold against your average shipping cost and product margin across order value bands.
Lever 4 — Fix Ad Spend Efficiency
Potential margin improvement: 3–10 percentage points on ad-driven orders
For stores running paid traffic, ad spend is often the largest single margin drag — and the most variable. A customer acquisition cost that drifted from $10 to $18 over six months without being noticed has compressed margin by 8 percentage points on every ad-attributed order.
Calculate Your Break-Even CAC and Monitor It
Break-even CAC is the maximum you can spend acquiring a customer before the order becomes unprofitable:
Break-even CAC = Gross profit per order
If gross profit per order is $22 (after COGS, shipping, and processing fees), every dollar of ad spend above $22 on that order is a loss. Most stores don't monitor actual CAC against break-even — they monitor ROAS, which doesn't account for costs. A campaign with a 3x ROAS on a 30% gross margin product is losing money: $1 in ad spend returns $3 in revenue and $0.90 in gross profit, meaning the ad spend isn't covered.
Calculating and tracking break-even CAC on a per-product basis turns ad efficiency from a revenue metric (ROAS) into a margin metric. Cut campaigns that exceed break-even CAC. Scale those that clear it.
Kill Low-Margin Products in Paid Campaigns
Not all products should be in your paid campaigns. A product with 25% gross margin needs a 4x ROAS just to break even on ad spend — leaving nothing for fixed costs and net profit. A product with 60% gross margin breaks even at 1.67x ROAS, leaving room for meaningful net margin even at modest ROAS performance.
Audit which products appear in your paid campaigns against their gross margin. Products below 40% gross margin in competitive ad environments often can't sustain profitable paid acquisition at current CPAs. Shift paid budget toward high-margin products and let low-margin products live on organic and email channels where CAC is near zero.
Reduce Ad Waste Through Audience Refinement
A significant portion of ad spend on most campaigns reaches people with no realistic intent to buy — wrong demographics, wrong geography, wrong stage of buying cycle. Audience refinement that raises click quality (higher CTR, lower wasted impressions) reduces cost per quality click and improves conversion rate — both of which reduce effective CAC without requiring higher creative investment.
Lever 5 — Shift Your Product Mix Toward Higher-Margin SKUs
Potential margin improvement: 2–6 percentage points on blended margin
The average margin of your store isn't determined by any single product — it's the blended margin across everything you sell. Shifting the product mix toward higher-margin SKUs improves blended margin without changing anything about your lowest-margin products.
Surface Your Highest-Margin Products
Most stores know which products sell most by volume and revenue. Few know which products contribute the most gross profit per unit and per dollar of revenue. Run a gross profit analysis across your catalog: rank every SKU by gross margin percentage and by total gross profit generated in the last 90 days.
The results often reveal a counterintuitive picture. Your bestselling product by volume may be mid-table on gross margin. A slower-selling SKU may generate the highest gross profit per order. This analysis tells you where merchandising, email promotions, homepage placement, and ad spend should be directed — toward the products that earn the most, not just the ones that sell the most.
Bundle High-Margin With Low-Margin Products
If a low-margin product has high demand, bundle it with a high-margin product rather than selling it standalone. The bundle price can be set to deliver your target blended margin on the combined order, and customers perceive value in the combination. You're not removing the low-margin product — you're improving the economics of selling it by attaching it to a higher-margin companion.
Sunset Chronically Low-Margin Products
Some products never make margin sense — they were launched at the wrong price, their supplier cost is non-negotiable, or they attract high return rates that compound the problem. Removing them from your catalog, or at minimum removing them from paid channel promotion, stops the margin drag they create on every order. Most stores have two or three SKUs that consume disproportionate operational attention relative to their margin contribution.
Lever 6 — Reduce Returns
Potential margin improvement: 1–4 percentage points
A 4% return rate on a $45 product costs approximately $8–$12 per returned order in actual costs (outbound shipping lost, return shipping if covered, processing fee non-refunded, restocking or write-off). At 300 orders a month, that's 12 returns — $96–$144/month in direct return cost, plus the customer service time.
The highest-impact return reduction moves: accurate product descriptions that set correct expectations (most returns from "not as described" are a listing problem), clear size guides for apparel, real product photography that represents colour and material accurately, and proactive post-purchase communication that reduces "where is my order?" returns before packages arrive.
Reducing your return rate from 4% to 2% on 300 monthly orders recovers 6 returns/month — roughly $60–$90/month in direct cost recovery, plus the downstream benefit to your chargeback rate.
Lever 7 — Audit and Cut App Overhead
Potential margin improvement: 0.5–2 percentage points
App subscriptions are fixed costs that scale poorly: they don't reduce as your margins compress, and most stores accumulate them faster than they evaluate them. A quarterly app audit — reviewing each paid app against the revenue or cost saving it demonstrably contributes — typically finds 2–4 apps that can be cancelled without impacting the store.
At $30–$50 per cancelled app, two cancellations is $60–$100/month recovered — small per order, real annually, and achievable in an afternoon.
The Margin Improvement Hierarchy
| Lever | Effort | Potential margin gain | Start with |
|---|---|---|---|
| Supplier cost negotiation | Medium | 3–8 pts | High volume products first |
| Switch to Shopify Payments | Low | Up to 2 pts | Immediately if not done |
| Upgrade plan at right volume | Low | 0.2–0.5 pts | Once above $25k/mo revenue |
| Shipping optimisation | Medium | 1–3 pts | Dimensional weight audit first |
| Fix ad CAC vs gross margin | Medium | 3–10 pts | Kill products below break-even first |
| Product mix shift | Low | 2–6 pts | Run gross margin by SKU first |
| Return rate reduction | Medium | 1–4 pts | Fix top return-reason products first |
| App audit | Low | 0.5–2 pts | Quarterly |
You Can't Improve a Margin You Can't See
Every lever in this guide requires knowing your current margin with enough precision to see whether the lever moved it. If your margin model is "Shopify revenue minus a rough estimate of costs," you won't know whether a supplier negotiation actually recovered the margin you expected, whether the shipping optimisation worked, or which ad campaigns are genuinely clearing break-even CAC.
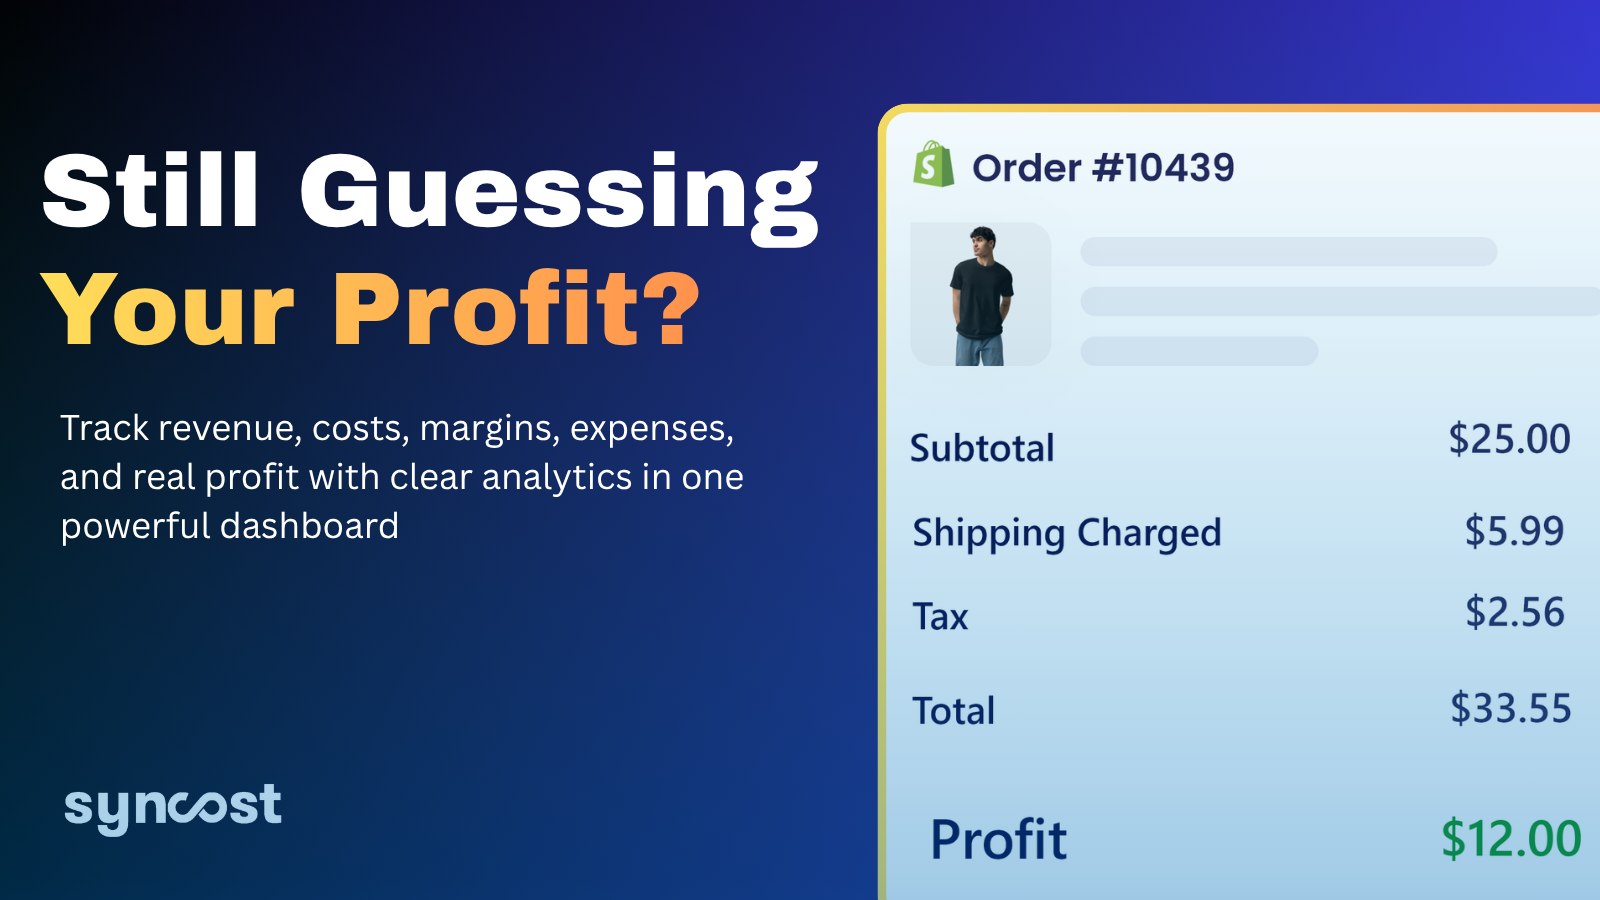
That's where Syncost makes the difference for Shopify merchants. It automatically brings together your product costs, Shopify fees, shipping, and ad spend into a single per-order view — so you can see, by product and by channel, which cost is dragging your margin and by how much. Pull the lever. Check the number. Confirm it moved. That's what margin improvement looks like when you can actually see the margin — and it's the difference between guessing at the problem and knowing exactly what to fix.
Margin improvement estimates are illustrative and vary by business model, supplier relationships, order volume, and market conditions. Run the analysis against your own data before projecting results.