The Blended ROAS Trap: Why Optimizing for In-Platform Ad Metrics Will Bankrupt Your Shopify Store
If you are scaling your e-commerce ad spend based on Facebook or Google’s reported ROAS, you are likely burning cash. Discover why in-platform attribution algorithms artificially inflate your profitability, and how pivoting to MER (Marketing Efficiency Ratio) is the only way to safeguard your true net margin.

The Hook & The Silent Problem
It is Monday morning. You open up your Meta Ads Manager, and the dashboard is glowing green. Your hero campaign is reporting a 3.5x Return on Ad Spend (ROAS). Google Ads is showing a 4.2x ROAS on your Performance Max campaigns. According to the platforms you are paying, you are printing money. Emboldened by this data, you instruct your media buying team to scale daily spend by 20%.
Thirty days later, you run your monthly P&L out of Shopify and your accounting software. The math doesn't add up. Despite the ad platforms claiming you generated $150,000 in attributed revenue on $40,000 in spend, your bank account is stagnant. After paying your supply chain, processing fees, and fixed overhead, you actually lost money.
How did the ad platforms lie to you?
They didn't lie; they did exactly what they were built to do: claim maximum credit for every touchpoint to justify your continued investment. Relying on platform-reported ROAS to dictate business decisions is like letting the casino dealer count your chips. They double-count conversions across platforms, claim organic sales as ad-driven, and ignore your actual Cost of Goods Sold (COGS).
If you want to stop bleeding cash, you must stop looking at platform ROAS and start managing your business using a metric the ad platforms cannot manipulate: the Marketing Efficiency Ratio (MER).
Core Concept Explained (The Quick Answer)
Platform ROAS is the revenue an ad platform claims it generated divided by the ad spend on that specific platform, often artificially inflated by cross-platform double-counting. Marketing Efficiency Ratio (MER), also known as "Blended ROAS," is your total global revenue (from all sources) divided by your total global marketing spend, providing a single source of truth for macro-level financial health.
The Deep-Dive Reference Guide
To understand why your P&L is bleeding while your ad accounts look profitable, you need to understand how these metrics differ fundamentally in their calculation and inherent bias.
| Metric | The Source Data | The Inherent Danger | Best Used For |
|---|---|---|---|
| In-Platform ROAS (e.g., Meta ROAS) | Pixel/Conversion API tracking from a single platform. | Severe Over-Attribution. Meta will claim a sale even if the user clicked a Google Ad right before buying. Ignores organic sales. | Micro-optimizations: Comparing Ad Creative A vs Ad Creative B within the same platform. |
| Blended ROAS / MER (Marketing Efficiency Ratio) | Shopify Total Gross Sales & Aggregate Spend across all platforms. | Macro-only. It will tell you if the business is profitable overall, but it won't tell you which specific ad drove the sale. | Macro-level budget allocation, determining overall store profitability, and setting baseline targets. |
| New Customer ROAS (ncROAS) | Only revenue generated from first-time buyers divided by total spend. | Painful Reality Check. Will often look terribly low compared to Blended ROAS, causing founders to panic. | Evaluating true growth and top-of-funnel customer acquisition effectiveness. |
| True Net Margin (Post-Ad) | Total Revenue minus Landed COGS, Gateway Fees, and Ad Spend. | Requires immaculate data hygiene. Fails completely if your Landed COGS in Shopify are incorrect. | Executive decision-making, investor reporting, and determining cash flow health. |
Technical Breakdown & Formulas
Calculating MER requires stripping away platform bias and looking strictly at the hard dollars moving through your merchant processor.
The In-Platform ROAS Formula (The Flawed View):
Meta_ROAS = Meta_Attributed_Conversion_Value / Meta_Ad_Spend

The MER Formula (The Macro Truth):
MER = Total_Store_Gross_Revenue / Total_Marketing_Spend_Across_All_Channels

Where:
- Total_Store_Gross_Revenue: Every dollar processed by Shopify (including organic, email, SMS, and paid).
- Total_Marketing_Spend: Meta Spend + Google Spend + TikTok Spend + Affiliate Payouts + Influencer Fees.

The True Net Margin Formula (The Ultimate Goal):
True_Net_Profit = Total_Store_Gross_Revenue - (Total_Landed_COGS + Payment_Gateway_Fees + Total_Marketing_Spend + OPEX)
Why this matters: If a customer clicks a Meta ad on Monday, signs up for your email list, clicks a Google retargeting ad on Wednesday, and finally buys via an abandoned cart SMS on Friday... Meta claims 100% of the revenue. Google claims 100% of the revenue. Klaviyo claims 100% of the revenue.
If you sum up the "Attributed Revenue" from all your dashboards, it will equal more than the actual money in your bank account. MER cuts through the noise by only looking at total cash in versus total cash out.
The Scaled Financial Impact (What It Actually Costs You)
Let’s model the catastrophic financial impact of scaling based on In-Platform ROAS versus scaling based on a strict MER target.
Assume you run an apparel brand. Your average order value (AOV) is $100. Your fully burdened Landed COGS is $35. Your fixed operating expenses (OpEx) are $10,000 per month.
The Illusion (Scaling by Platform ROAS)
You spend $20,000 on Meta and $10,000 on Google.
- Meta Dashboard: Claims $70,000 in revenue (3.5x ROAS).
- Google Dashboard: Claims $40,000 in revenue (4.0x ROAS).
- Email/Organic: Generates $20,000.
- Total "Claimed" Revenue: $130,000.
- The Reality: Due to double-counting, your actual Shopify Gross Revenue is only $90,000 (900 orders).
Let's look at the actual P&L:
- Actual Revenue: $90,000
- Landed COGS (900 units @ $35): $31,500
- Ad Spend: $30,000
- Gateway Fees (3%): $2,700
- Fixed OpEx: $10,000
- True Net Profit: $15,800 (17.5% Net Margin)
The founder, seeing a combined 3.6x platform ROAS, decides to aggressively scale ad spend the next month.
The Trap (Scaling into Unprofitability)
Next month, you double spend: $40,000 on Meta, $20,000 on Google. As spend increases, efficiency drops.
- Meta Dashboard: Claims $110,000 in revenue (2.75x ROAS - still looks profitable on paper!).
- Google Dashboard: Claims $60,000 in revenue (3.0x ROAS).
- Actual Shopify Revenue: Scales to $140,000 (1,400 orders).
Let's look at the new P&L:
- Actual Revenue: $140,000
- Landed COGS (1,400 units @ $35): $49,000
- Ad Spend: $60,000
- Gateway Fees (3%): $4,200
- Fixed OpEx: $10,000
- True Net Profit: $16,800 (12% Net Margin)
The Result: You doubled your ad risk, shipped 500 more physical units out the door, increased your customer support load, and only made an extra $1,000 in net profit. If your COGS were even slightly off, or if you had a high return rate, you would have lost money.
Strategic Execution (How to Apply This to Your Business)
Moving away from platform-centric metrics requires a behavioral shift for both founders and media buyers. Here is how you execute the transition.
-
Establish Your Break-Even MER: Calculate your absolute floor. You must know the exact number where your business goes into the red. If your Gross Margin (after COGS and processing fees) is 60%, your Break-Even MER is 1.66 (1 / 0.60). If your total store revenue divided by total ad spend ever dips below 1.66, you are losing money, regardless of what Facebook says.
-
Set Daily Blended Spend Targets: Change media buyer incentives. Stop giving your agency or media buyers a "ROAS target." Give them a Blended MER target. Tell them: "You have a budget of $2,000 a day across all platforms. As long as the total Shopify store revenue hits $8,000 for the day (a 4.0 MER), you can spend the budget however you see fit."
-
Relegate In-Platform Metrics to Creative Testing: Use ROAS only for micro-decisions. Do not turn off Facebook completely. Use platform ROAS for its only valid purpose: comparing apples to apples within the platform. If Ad Creative A has a 2.0 Meta ROAS and Ad Creative B has a 1.2 Meta ROAS, you know Creative A is better. But you do not use that 2.0 to project your bank balance.
-
Track MER on a 7-Day Rolling Average: Account for the latency effect. Ad spend deployed on Tuesday might not yield a purchase until Friday. Tracking MER on a strict 24-hour window will cause you to panic and make emotional budget cuts. Track your MER on a 7-day and 14-day rolling average to smooth out attribution latency.
Frequently Asked Questions (FAQ)
If I switch to MER, how do I know which specific platform is actually driving the sales?
MER does not solve the attribution problem; it solves the profitability problem. To understand specific platform contribution, you must run "incrementality tests." Turn off Google Ads entirely for 7 days while keeping Meta steady. Watch what happens to your total Shopify revenue. The delta is your true incremental lift from Google.
Why is my Google Analytics (GA4) revenue different from my Shopify revenue?
GA4 relies on browser-side tracking and cookies, which are easily blocked by iOS updates, ad blockers, and privacy browsers (like Brave or Safari). Shopify processes the actual server-side credit card transaction. Shopify is the absolute ground truth. If GA4 says you made $10,000 and Shopify says you made $8,000, you only have $8,000 in the bank.
Does MER account for returning customer revenue?
Yes, standard MER includes all revenue, which means a high percentage of returning customers (who you acquired cheaply via email/SMS) will artificially inflate your MER, making your paid acquisition look more efficient than it is. This is why advanced operators track both eMER (Ecosystem MER) and ncMER (New Customer MER).
How do I calculate New Customer MER (ncMER)?
Take your total revenue strictly from first-time buyers (pulled from Shopify cohort reports) and divide it by your total ad spend. This tells you exactly how much it costs to bring fresh cash into the ecosystem, isolated from the recurring revenue of your loyal base.
From Financial Chaos to Verified Profit
You cannot out-market bad unit economics, and you cannot scale a business using manipulated vanity metrics. If you are logging into five different dashboards, pasting numbers into a Google Sheet, and praying the math at the end of the month aligns with your bank account, you are operating in the dark.
This is exactly why top-tier DTC operators rely on Syncost.
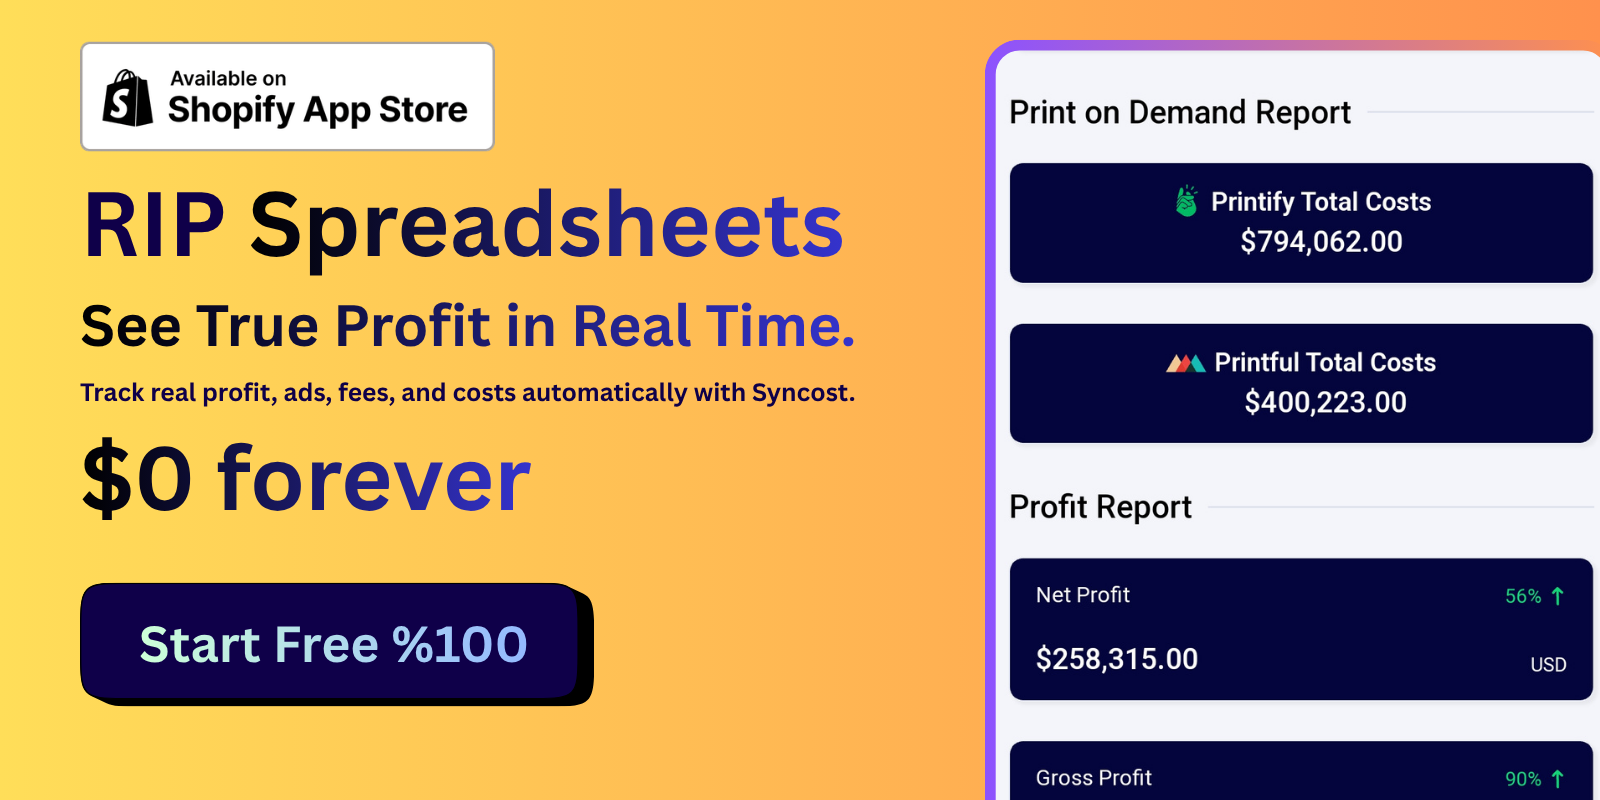
Syncost eliminates the "attribution illusion" by bypassing the ad platform's manipulated data. It pulls your gross revenue directly from Shopify, automatically deducts your exact, fully-burdened Landed COGS, subtracts live ad spend from Meta and Google, and factors in dynamic payment gateway fees.
The result? A real-time, profit-tracking dashboard that gives you your exact Marketing Efficiency Ratio (MER) and True Net Profit, down to the penny, updated every minute. Stop letting ad platforms dictate your profitability. Install Syncost, uncover your true net margin, and scale your business with absolute financial certainty.