The Shopify COGS Trap: How a $6 Error Becomes a $30,000 Profit Leak
A $6 mistake in product cost looks harmless when you sell 100 units. At 5,000 units, the same mistake quietly turns into $30,000 of overstated profit—and it can push you to scale products that were never as profitable as your dashboard suggested. Here is how to calculate Shopify COGS correctly, separate product cost from landed cost, and build a profit system that reflects what your business actually keeps.

The Hook & The Silent Problem: The $6 Error Nobody Notices
There is a dangerous stage in ecommerce where the business looks healthier than it actually is.
Orders are coming in. Revenue is increasing. The bestselling product is climbing the sales report. Advertising is producing conversions. The Shopify dashboard looks clean. The founder sees a product selling for $60 with a listed product cost of $18 and immediately starts thinking about scale.
The apparent product economics look excellent.
A $60 selling price minus an $18 product cost produces a $42 gross profit per unit.
That is a 70% gross margin on the simplified product-cost calculation.
So the merchant increases the advertising budget.
Then they order more inventory.
Then they negotiate a larger production run.
Then they hire another contractor.
The problem is not that any of those decisions are automatically wrong.
The problem is that the $18 may not actually represent what that product costs the business.
Maybe the factory price increased to $20.
Maybe inbound freight added $1.80 per unit.
Maybe customs, duties, receiving, inspection, or other directly attributable supply-chain costs added another $1.20.
Maybe packaging changed.
Maybe the store has begun using a more expensive fulfillment method.
Maybe the product is being sold with a promotional discount.
Maybe the merchant is also spending substantially more to acquire each customer than when the original unit economics were calculated.
The spreadsheet still says:
Selling price = $60 Product cost = $18 Gross profit = $42
But operational reality may be closer to:
Selling price = $60 Effective product cost = $24 Shipping = $7 Payment/transaction costs = $2.10 Advertising = $12 Other allocated operating costs = $3 Approximate contribution after these costs = $11.90
That difference is not theoretical.
The original calculation treated the product as if it generated $42 before downstream costs. The more complete unit economics view shows that only a fraction of that amount remains after the costs required to acquire and fulfill the sale.
And the most dangerous part is the scale.
A $6 error does not feel important when you look at one order.
At 100 units, it is $600.
At 1,000 units, it is $6,000.
At 5,000 units, it is $30,000.
That is why cost accuracy is not an accounting detail reserved for month-end bookkeeping.
It is a scaling decision system.
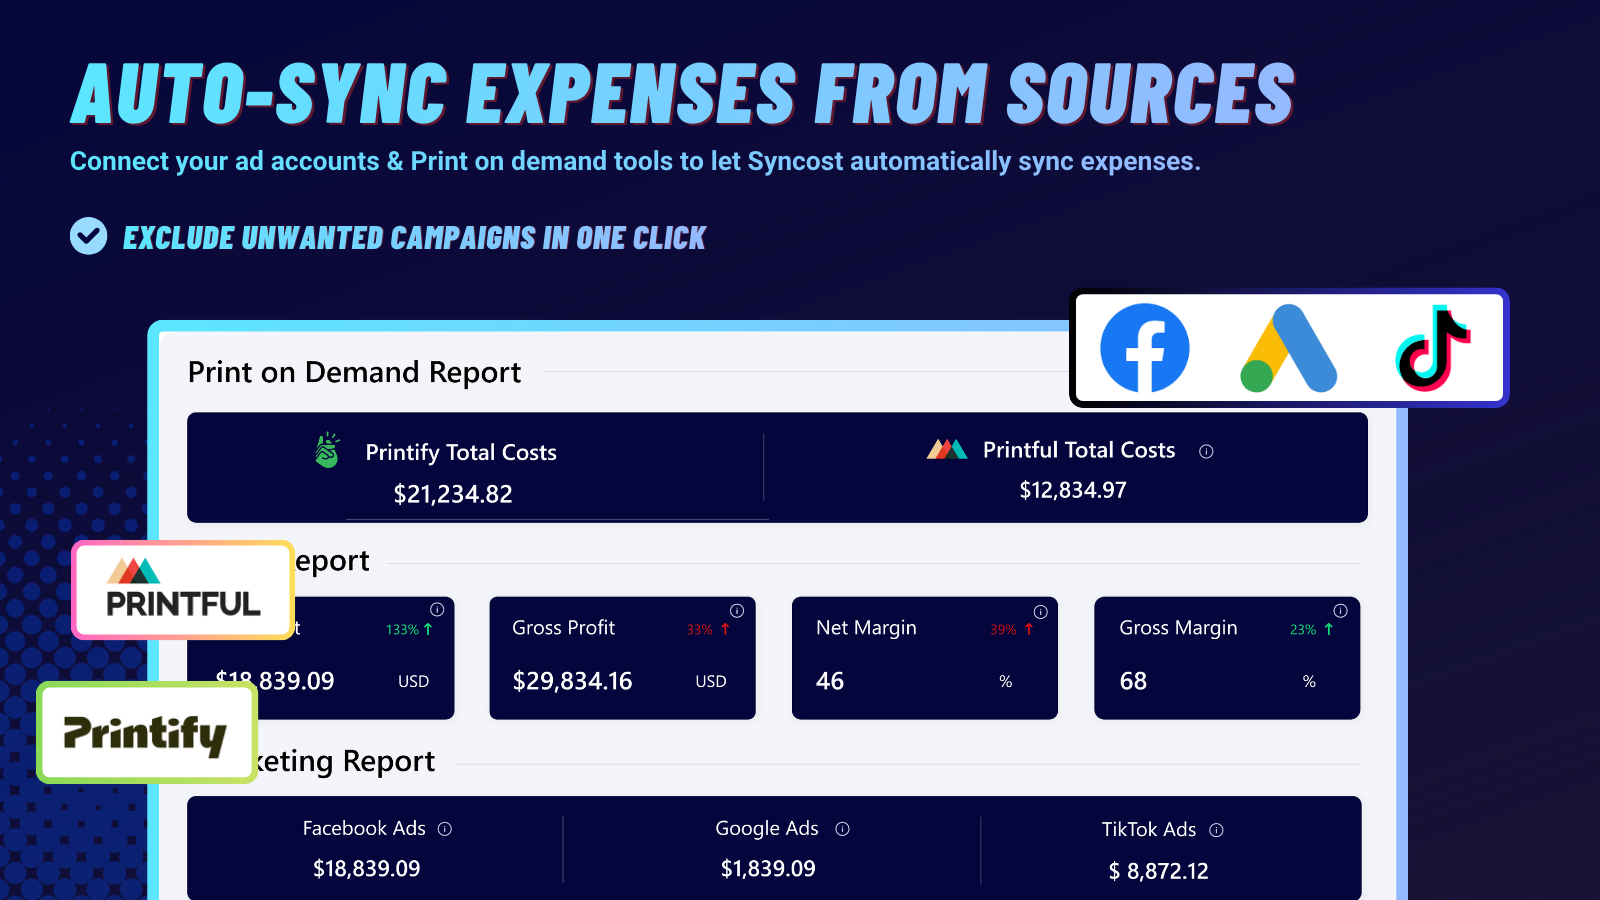
Shopify provides a product cost field and profitability reporting capabilities, but merchants still need to make sure the cost information being used reflects their actual operating economics. Syncost's current product positioning is built around bringing COGS, custom costs, transaction fees, shipping, advertising, fulfillment and order-level profitability into a consolidated profit view rather than forcing merchants to reconcile those figures manually.
The goal is not to make your dashboard look more sophisticated.
The goal is to stop making decisions with numbers that are directionally wrong.
Core Concept Explained (The Quick Answer)
COGS (Cost of Goods Sold) is the direct cost attributable to the products you sell, while landed product cost goes further by incorporating directly attributable costs required to get inventory into a sellable location.
The critical distinction is that a Shopify "Cost per item" number is only useful if it is kept aligned with the underlying economics of the product. And COGS alone is not net profit: a serious ecommerce profit model must also account for shipping, transaction fees, advertising, refunds, discounts, and applicable operating expenses.
A useful operating framework is:
Revenue is what the customer paid. Gross profit is what remains after COGS. Contribution profit is what remains after variable selling and fulfillment costs. Net profit is what remains after the broader expense structure.
Confusing these layers is one of the fastest ways to create false confidence.
The Deep-Dive Reference Guide
| Cost Layer | What It Represents | Example | Usually Used For | What Goes Wrong When Missing |
|---|---|---|---|---|
| Selling Price | Customer-facing price before applicable deductions | $60 | Pricing strategy | Margin appears larger than actual cash contribution |
| Discounts | Revenue reductions caused by promotions or coupons | $5 | Net revenue | Profit is overstated if analysis uses full list price |
| Refunds | Revenue returned to customers | $3 | Net revenue | Acquisition and product economics look better than reality |
| Product COGS | Direct product cost associated with units sold | $18 | Gross profit | Gross margin becomes unreliable |
| Landed Product Cost | Product cost plus directly attributable inbound supply-chain costs | $24 | Unit economics | Product appears cheaper than it really is |
| Fulfillment Shipping | Cost paid to deliver the order to the customer | $7 | Contribution profit | High-revenue orders may actually generate weak contribution |
| Payment/Transaction Fees | Costs associated with processing the transaction | $2.10 | Contribution profit | Revenue gets mistaken for cash retained |
| Advertising Spend | Customer acquisition expenditure attributed to sales | $12 | Contribution profit | Scaling decisions become disconnected from acquisition cost |
| Custom Operating Costs | Software, utilities, subscriptions and other configured business expenses | $3 allocated | Net profit | Operational overhead disappears from analysis |
| Gross Profit | Revenue minus COGS | $36 after $24 COGS on $60 revenue | Product economics | Can be mistaken for actual take-home profit |
| Contribution Profit | Revenue minus variable product, fulfillment, transaction and marketing costs | Varies | Scaling decisions | CAC and fulfillment efficiency remain hidden |
| Net Profit | Revenue minus the full relevant cost structure | Varies | Business performance | Business can look successful while producing weak actual profit |
| Gross Margin | Gross profit ÷ revenue | 60% | Product and pricing analysis | Can be misleading when interpreted as net margin |
| Contribution Margin | Contribution profit ÷ revenue | Varies | Scaling and advertising decisions | Shows whether additional sales are economically attractive |
| Net Margin | Net profit ÷ revenue | Varies | Overall business health | Reveals whether growth is actually creating earnings |
The table exposes the fundamental problem: there is no single "profit number" that answers every business question.
A product manager needs gross margin.
A performance marketer needs contribution margin.
An owner needs net profit.
An operator needs cost variance.
A buyer needs accurate unit economics.
An accountant needs a clean reconciliation between operational records and financial records.
The mistake is not using one particular metric.
The mistake is using one metric as though it answers all of those questions.
Technical Breakdown & Formulas
The first formula is intentionally simple:
Gross Profit = Net Revenue - COGS
Where:
Net Revenue = Gross Sales - Discounts - Refunds
And:
Gross Margin % = (Net Revenue - COGS) / Net Revenue × 100
This is the basic product-economics layer.
It answers:
"After accounting for the products sold, how much revenue is left?"
It does not answer:
"How much money did this order contribute after acquiring, processing, and fulfilling the customer?"
For that, the model needs to go deeper.
Contribution Profit
= Net Revenue
- COGS
- Fulfillment Shipping
- Transaction Fees
- Variable Advertising Cost
- Other Variable Selling Costs
And:
Contribution Margin %
= Contribution Profit / Net Revenue × 100
A broader operational model can then be expressed as:
Net Profit
= Net Revenue
- COGS
- Fulfillment Costs
- Transaction Fees
- Advertising Spend
- Refund / Chargeback Costs
- Custom Operating Expenses
- Other Applicable Expenses
The exact accounting treatment of individual expenses can differ depending on the business model and accounting policy. The important operational principle is simpler:
Every cost that materially changes the economic value of a sale must be visible somewhere in your decision model.
Variable 1: Net Revenue
Gross sales are not always the final economic revenue number.
Imagine a product listed for $60.
A customer receives a $5 discount.
The customer later receives a $10 partial refund.
The merchant cannot responsibly evaluate the transaction as though the business retained the full $60.
A simplified calculation becomes:
Gross Sales = $60
Discount = $5
Refund = $10

Net Revenue = $60 - $5 - $10
Net Revenue = $45
That $45 is a dramatically different starting point for margin analysis.
The more important the promotional strategy becomes, the more dangerous it is to analyze profitability from sticker price instead of realized revenue.
Variable 2: COGS
COGS should correspond to the direct product costs associated with units sold under the merchant's accounting approach.
For a simple product:
Unit COGS = Supplier Product Cost
But operational reality can be more complicated.
A merchant might purchase a product for $18 but incur directly attributable inbound costs before the inventory is available for sale.
A useful landed-cost model can therefore be expressed as:
Landed Unit Cost
= Product Purchase Cost
+ Inbound Freight Allocation
+ Duties / Tariffs Allocation
+ Receiving / Handling Allocation
+ Other Directly Attributable Costs
Example:
Product purchase cost = $18.00
Inbound freight allocation = $2.40
Duty / import allocation = $1.20
Receiving / handling allocation = $0.40

Landed unit cost = $22.00
Whether every component is classified as COGS in formal financial statements depends on the accounting framework and policy being used.
For operational ecommerce analysis, however, the distinction is extremely valuable:
The product did not become economically available to the business at $18 if another $4 was required to get it into its sellable inventory position.
Variable 3: Shipping
Shipping is one of the most frequently misunderstood parts of ecommerce unit economics.
Consider two stores selling the exact same product for $60.
Store A pays $4 to fulfill the order.
Store B pays $9.
They have the same revenue.
They have the same supplier cost.
They may even have the same advertising efficiency.
But Store B has a structurally lower contribution margin.
That difference can be invisible if the merchant only watches selling price and COGS.
A shipping model can be represented as:
Net Fulfillment Shipping Cost
= Actual Shipping Cost Paid
- Shipping Revenue Collected From Customer
For example:
Shipping charged to customer = $5
Shipping paid to carrier / fulfillment provider = $8

Net shipping cost = $8 - $5
Net shipping cost = $3
This is why comparing the shipping price shown at checkout with the actual shipping expense is so important.
Variable 4: Transaction Fees
Transaction fees are small enough per order to be psychologically ignored.
That is exactly why they become dangerous at scale.
Suppose an order produces $2.40 in transaction-related costs.
That feels insignificant next to a $60 sale.
But:
100 orders × $2.40 = $240
And:
5,000 orders × $2.40 = $12,000
The individual transaction is small.
The aggregate financial impact is not.
Variable 5: Advertising Cost
A product does not become profitable merely because customers bought it.
The merchant must also ask:
What did it cost to generate those customers?
For an order-level model:
Contribution After Advertising
= Contribution Before Advertising
- Attributed Advertising Cost
A product generating $20 before customer acquisition costs is not automatically a good product.
If acquiring the customer consumes $18, the remaining contribution is only $2.
If acquisition rises to $23, the exact same product becomes economically negative under that model.
This is why revenue growth can coexist with deteriorating profitability.
Variable 6: Custom Expenses
Not every cost belongs inside a product's variable unit economics.
Some costs are recurring business expenses:
Software
Subscriptions
Utilities
Phone / Internet
Professional Services
Operational Overhead
These can be tracked separately and then considered at the business-profit level.
A merchant should not randomly bury overhead inside product COGS just to make every SKU appear to have a complete accounting statement.
That creates another form of distortion.
The better principle is:
Classify costs correctly, then make sure the relevant cost layer is included in the metric being used for the decision.
The Scaled Financial Impact (What It Actually Costs You)
Now consider a realistic ecommerce example.
A Shopify store sells one product for:
Selling Price = $60.00
The merchant's dashboard contains:
Recorded Product Cost = $18.00
But after reviewing purchasing and inbound supply-chain costs, the merchant discovers that the economically relevant landed product cost is:
True Landed Product Cost = $24.00
That is only a:
$24 - $18 = $6
difference.
Six dollars.
It sounds harmless.
It isn't.
Let's model the order.
Assume:
Selling price = $60.00
True product cost = $24.00
Fulfillment shipping = $7.00
Transaction fees = $2.10
Advertising cost = $12.00
Allocated operating costs = $3.00
What the incorrect model says
The merchant incorrectly believes product cost is $18.
$60.00
- $18.00 COGS
- $7.00 shipping
- $2.10 transaction fees
- $12.00 advertising
- $3.00 operating costs
= $17.90
The dashboard therefore suggests:
Apparent profit = $17.90 per order
What the corrected model says
The actual landed product cost is $24.
$60.00
- $24.00 product cost
- $7.00 shipping
- $2.10 transaction fees
- $12.00 advertising
- $3.00 operating costs
= $11.90
The actual modeled profit is therefore:
True profit = $11.90 per order
The difference is exactly:
$17.90 - $11.90 = $6.00
The store was overstating profit by $6 on every order.
At 100 units
100 × $6 = $600
The merchant's reporting system can therefore make the business appear:
$600 more profitable than the corrected model
That may not feel catastrophic.
At 1,000 units
1,000 × $6 = $6,000
Now the error is large enough to influence inventory purchasing, advertising budgets, and management decisions.
At 5,000 units
5,000 × $6 = $30,000
The exact same six-dollar error has now created:
$30,000 of overstated cumulative profit.
And that is only the direct arithmetic error.
The strategic cost can be larger.
Suppose the merchant uses the false $17.90 profit estimate to justify scaling advertising.
The merchant might think:
Maximum acceptable acquisition cost ≈ $17.90
But the corrected contribution before advertising tells a different story.
Before advertising:
$60
- $24 COGS
- $7 shipping
- $2.10 transaction fees
- $3 other operating allocation
= $23.90
The business has approximately $23.90 available before customer acquisition expenditure.
If advertising costs $12:
$23.90 - $12 = $11.90
That is still positive under our simplified model.
But imagine advertising becomes $20.
The same product becomes:
$23.90 - $20 = $3.90
At $25 of acquisition cost:
$23.90 - $25 = -$1.10
The store would now be losing approximately $1.10 on the modeled order contribution.
This is the critical point:
An inaccurate COGS number does not simply make a report inaccurate. It changes the boundaries within which the merchant thinks it is safe to spend.
That can cause a feedback loop:
Understated Cost
      ↓
Overstated Margin
      ↓
Higher Confidence
      ↓
More Aggressive Ad Spend
      ↓
More Orders
      ↓
More Exposure to the Cost Error
      ↓
Larger Dollar Loss
At 5,000 units, the cost error is no longer a reporting inconvenience.
It becomes a capital-allocation problem.
And the larger the store gets, the more dangerous manual cost maintenance becomes because a single incorrect input can propagate through hundreds or thousands of future decisions.
Strategic Execution (How to Apply This to Your Business)
The solution is not simply "enter better numbers into Shopify."
The solution is to build a repeatable cost-control workflow.
Step 1: Build a Cost Inventory
Start by listing every cost that can materially affect the economics of a sale.
Separate them into logical groups:
Product Costs
- Supplier price
- Materials
- Packaging
- Product components

Inbound Costs
- Freight
- Duties
- Customs
- Receiving
- Direct handling

Fulfillment Costs
- Pick and pack
- Outbound shipping
- 3PL fees
- Fulfillment surcharges

Selling Costs
- Payment fees
- Transaction fees
- Marketplace / platform fees
- Advertising

Business Expenses
- Software
- Subscriptions
- Utilities
- Professional services
- Other recurring overhead
The purpose is not to force all of these into one accounting category.
The purpose is to stop important costs from disappearing between systems.
Step 2: Separate Product COGS From the Broader Cost Stack
Do not solve one reporting problem by creating another.
COGS should remain a meaningful measure of product cost.
Shipping should remain identifiable.
Advertising should remain identifiable.
Transaction fees should remain identifiable.
Operating overhead should remain identifiable.
That separation makes your reporting more useful because you can answer different questions.
For example:
Why is this product's gross margin falling?
Look at COGS.
Why is this product's contribution falling even though COGS is stable?
Look at shipping, transaction fees, and advertising.
Why is company-level net profit falling even though contribution margin is healthy?
Look at operating expenses.
Step 3: Audit Your "Cost per Item" Data
Open your product catalog and challenge the numbers.
Do not ask:
"Did someone enter a number?"
Ask:
"Can we prove this number is still economically accurate?"
Review:
- Supplier price changes
- Variant-level pricing differences
- New packaging
- Freight changes
- Product modifications
- New suppliers
- New fulfillment arrangements
- Currency movements where relevant
- Bulk purchasing changes
- Promotions that alter realized revenue
A static number can be perfectly accurate on Monday and materially wrong months later.
Step 4: Validate Variant-Level Economics
One of the easiest traps is treating an entire product as though every variant has the same cost.
Imagine:
Small = $12 COGS
Medium = $13 COGS
Large = $15 COGS
XL = $17 COGS
If every variant is recorded as $12, the store may look more profitable as sales move toward larger sizes.
The sales dashboard will still be correct.
The revenue number will still be correct.
The order count will still be correct.
The profit analysis will be wrong.
Variant-level costs matter because ecommerce profitability is ultimately determined at the level of the units actually sold.
Step 5: Reconcile Costs Against Actual Orders
Do not stop at product-level analysis.
Take representative orders and reconstruct them from the bottom up.
For each order, ask:
What did the customer pay?
What was discounted?
What was refunded?
What did the product cost?
What did fulfillment cost?
What did transaction processing cost?
What advertising expense should be attributed?
What other relevant variable costs apply?
What remains?
Then compare your independently calculated result with your analytics platform.
The goal is not to find a dashboard number that looks reasonable.
The goal is to prove the number.
Step 6: Monitor Cost Variance Instead of Waiting for Month-End
A strong ecommerce finance process does not merely report historical costs.
It detects changes.
For example:
Supplier cost: $18 → $20
Shipping: $6 → $7
Ad cost/order: $11 → $14
Even though none of those changes appears individually catastrophic, the combined effect can be significant.
The merchant needs to see the margin deterioration as it occurs.
Syncost's current product positioning specifically emphasizes real-time store analytics, automated P&L reporting, order-level profitability, custom costs, shipping configuration, and integrations that bring store, advertising and fulfillment cost sources together.
Step 7: Use P&L Analysis to Validate the Bigger Picture
Order profitability is not the whole business.
You also need periodic P&L analysis.
A practical hierarchy is:
Level 1 — Order
What did this transaction contribute?

Level 2 — Product
Which SKUs and variants create contribution?

Level 3 — Channel
Which acquisition and sales channels create contribution?

Level 4 — Day / Week / Month
When is profitability improving or deteriorating?

Level 5 — Business
After the broader expense structure, did the company actually make money?
This prevents a common management mistake:
Optimizing the SKU while ignoring the business.
A product can be highly profitable while the company remains unprofitable because overhead is excessive.
The reverse can also happen: a SKU may have a mediocre apparent margin but contribute meaningful profit because it drives repeat purchases, bundles, or low acquisition costs.
The numbers have to be viewed at the correct level.
Step 8: Set a Cost-Change Review Trigger
Do not wait until the annual financial review to inspect costs.
Create an operational rule such as:
If unit cost changes by >5%:
    Review margin.

If fulfillment cost changes by >5%:
    Review contribution.

If advertising cost/order changes materially:
    Review acquisition economics.

If refund rate changes materially:
    Review realized revenue and product economics.
The exact threshold should be appropriate for your business.
The important part is having a threshold.
Without one, cost drift becomes invisible until the financial impact is already significant.
Step 9: Stop Using Revenue as the Primary Scaling Signal
Revenue is useful.
Revenue is not enough.
A better decision hierarchy is:
Revenue Growth
      ↓
Gross Margin
      ↓
Contribution Margin
      ↓
Net Profit
      ↓
Cash Flow / Working Capital Reality
A store producing $100,000 in monthly revenue is not necessarily stronger than one producing $70,000.
The $70,000 store may have dramatically better contribution margins, lower acquisition costs, healthier inventory turns, and lower operating expenses.
The question is not:
"How much did we sell?"
The question is:
"What did selling it create?"
Frequently Asked Questions (FAQ)
What is the correct way to calculate COGS for a Shopify store?
At the most basic level, COGS represents the direct product costs associated with units sold. For operational ecommerce analysis, merchants should also evaluate whether directly attributable inbound costs materially affect their true landed unit economics. The key is to keep product cost definitions consistent and documented.
A simplified calculation is:
COGS = Unit Product Cost × Quantity Sold
For more complex operations:
Landed Unit Cost
= Product Cost
+ Allocated Direct Inbound Costs
Then use the appropriate accounting classification for formal financial reporting.
The biggest mistake is not choosing one specific formula.
It is allowing the underlying cost number to become outdated while continuing to make decisions as though it were current.
Why is my Shopify gross profit higher than my actual profit?
Because gross profit generally removes product cost from revenue, while actual business profit can also be affected by shipping, transaction fees, advertising, refunds, chargebacks, subscriptions, utilities and other expenses.
For example:
Revenue = $60
COGS = $24

Gross Profit = $36
That does not mean the business kept $36.
If additional order-related costs total $24.10:
$36 - $24.10 = $11.90
The difference between gross profit and final profit is where many ecommerce merchants lose visibility.
Syncost is designed around precisely this broader visibility, including COGS, order profitability, transaction-related costs, shipping, advertising and custom expenses within a consolidated analytics workflow.
How often should Shopify COGS be updated?
There is no universal calendar interval that works for every store.
The correct answer is:
Update COGS whenever the underlying economics materially change, and establish a recurring review cycle so changes are not missed.
A merchant with stable domestic sourcing may experience relatively little cost movement.
A merchant dealing with changing supplier prices, international freight, multiple variants, currency exposure or dynamic fulfillment costs may need much more frequent review.
The operational objective is not "update COGS every 30 days."
It is:
Do not make today's decisions using yesterday's economics.
How do I calculate true profit per Shopify order?
Start with realized revenue rather than list price.
Then subtract the costs that apply to the order:
Order Profit
= Net Revenue
- Product COGS
- Fulfillment / Shipping Cost
- Transaction Fees
- Attributed Advertising Cost
- Other Relevant Variable Costs
For business-level net profit, incorporate the broader operating expense structure as appropriate.
The advantage of an order-level model is that it prevents profitable and unprofitable orders from being averaged into one misleading monthly number.
A store can report a healthy monthly average while simultaneously losing money on an important subset of orders.
That is why order-level profitability is one of the most useful diagnostic layers for scaling ecommerce operations.
From Financial Chaos to Verified Profit
The real problem with ecommerce profitability is rarely the absence of data.
There is usually too much data.
The store has sales data.
The payment processor has transaction information.
The advertising platforms have spend.
The fulfillment provider has shipping costs.
The supplier has product invoices.
The ecommerce platform has product costs.
The accounting system has expenses.
The problem is that these systems do not automatically become one coherent economic model simply because each system contains accurate information.
That is where manual spreadsheets start appearing.
One spreadsheet calculates COGS.
Another tracks advertising.
Another tracks shipping.
Another contains subscriptions.
Someone exports Shopify orders.
Someone manually adjusts refunds.
Someone reconciles transactions at the end of the month.
Eventually the owner asks:
"So, what did we actually make?"
And someone starts opening six tabs.
That is not a scalable financial system.
Syncost is built to eliminate that fragmented workflow by bringing the relevant cost layers into one profit analytics environment.
Its current platform includes a real-time analytics dashboard, automated P&L reports, order-level profitability tracking, custom cost management, shipping setup, and integrations connecting Shopify with advertising and fulfillment/POD cost sources.
The practical difference is important.
Instead of:
Shopify
   ↓
Export
   ↓
Spreadsheet
   ↓
Advertising export
   ↓
Shipping calculation
   ↓
Manual COGS adjustment
   ↓
More formulas
   ↓
More reconciliation
   ↓
Guess
The objective becomes:
Shopify Orders
      +
COGS
      +
Advertising
      +
Shipping
      +
Transaction Costs
      +
Custom Expenses
      ↓
Unified Profit View
      ↓
Order Profitability
      ↓
Product Economics
      ↓
P&L
      ↓
Better Decisions
That bottom-up approach matters because the most important number in ecommerce is not the revenue number at the top of the dashboard.
It is the economic result at the bottom.
A product generating $60 in revenue is not necessarily a $60 success.
A product with a 70% apparent gross margin is not necessarily a 70% profit opportunity.
And a $6 cost error is not "only $6" when you have thousands of transactions.
At 100 units:
100 × $6 = $600
At 5,000 units:
5,000 × $6 = $30,000
That is the core lesson.
Profitability is a system of connected numbers, not a single dashboard metric.
The stores that scale intelligently are not necessarily the stores with the highest revenue.
They are the stores that know which revenue is profitable, which products create contribution, which costs are moving, and where margin is disappearing before the damage compounds.
That is the difference between tracking sales and managing a business.
Syncost's goal is to make that distinction visible every day: not just what your Shopify store sold, but what those sales were actually worth after the costs required to generate, fulfill, and operate them.