Shopify Contribution Margin: The Metric That Tells You What You Can Safely Spend on Ads
A Shopify store can have strong revenue, healthy-looking ROAS, and still lose money on every new customer. Contribution margin reveals what is actually left after COGS, shipping, transaction fees, and other variable costs—so you can determine how much you can safely spend to acquire a sale without scaling yourself into a loss.

The Hook & The Silent Problem: Your ROAS Can Look Great While Your Store Loses Money
There is a number that ecommerce merchants obsess over because it feels like a verdict.
ROAS.
The dashboard says:
ROAS = 3.5x
The merchant sees $3.50 in attributed revenue for every $1 spent on advertising and thinks:
"The campaign is working. Increase the budget."
So the daily budget goes from $100 to $250.
Then $250 becomes $500.
Orders increase.
Revenue increases.
The advertising platform celebrates.
The Shopify dashboard shows a healthy sales curve.
And yet the bank balance does not behave the way the revenue chart suggests it should.
This is one of the most expensive misunderstandings in performance ecommerce:
ROAS measures advertising revenue efficiency. It does not, by itself, tell you whether the sale was profitable.
Imagine a store sells a product for $80.
The advertising campaign generates $240 in attributed revenue from $80 of ad spend.
The ROAS is:
ROAS = Revenue / Ad Spend
ROAS = $240 / $80
ROAS = 3.00x
That sounds good.
But now inspect what happens after the sale.
Suppose the $240 of revenue came from three $80 orders.
Each order has:
Selling Price = $80
Product COGS = $28
Shipping = $9
Transaction Fees = $3
Before advertising, each order contributes:
$80
- $28 COGS
- $9 Shipping
- $3 Transaction Fees
= $40
Three orders therefore contribute:
3 × $40 = $120
Advertising consumed:
$80
So the campaign-level contribution after advertising becomes:
$120 - $80 = $40
The campaign is still profitable under this simplified example.
But now suppose the store's product cost is $34 instead of $28.
The exact same 3.0x ROAS now produces:
$80
- $34 COGS
- $9 Shipping
- $3 Fees
= $34 contribution per order
Three orders:
3 × $34 = $102
After advertising:
$102 - $80 = $22
The same ROAS.
The same revenue.
The same ad spend.
A radically different contribution result.
And once other variable costs enter the picture, the gap becomes even larger.
This is why revenue efficiency and profit efficiency are not the same thing.
A merchant can optimize the advertising dashboard while accidentally destroying the economics of the store.
The answer is not to abandon ROAS.
The answer is to stop treating it as the final financial truth.
Contribution margin tells you how much economic value remains after the variable costs required to produce and fulfill the sale.
That makes it one of the most useful metrics for answering the question that ROAS cannot answer on its own:
"How much can I afford to spend to acquire this order before I destroy profit?"
This distinction becomes especially important as a store scales. A campaign generating hundreds of orders can magnify a tiny per-order economic mistake into thousands or tens of thousands of dollars.
Core Concept Explained (The Quick Answer)
Contribution margin is the percentage of net revenue remaining after subtracting the variable costs required to generate and fulfill a sale.
A simplified ecommerce formula is:
Contribution Profit
= Net Revenue
- Product COGS
- Shipping / Fulfillment
- Transaction Fees
- Other Variable Selling Costs
- Advertising Spend
And:
Contribution Margin %
= Contribution Profit / Net Revenue × 100
The key operational difference is that gross margin stops at product cost, while contribution margin goes further into the economics of actually selling and fulfilling the order.
That makes contribution margin much more useful for decisions involving:
advertising budgets, CAC limits, promotions, scaling thresholds, product selection, channel allocation, and discount strategy.
The Deep-Dive Reference Guide
| Metric | Formula / Definition | What It Tells You | What It Does Not Tell You |
|---|---|---|---|
| Gross Sales | Customer purchase value before deductions | Top-line sales volume | What the business actually retained |
| Net Revenue | Gross Sales - Discounts - Refunds | Realized sales value | Full profitability |
| COGS | Direct product cost associated with units sold | Product-level gross economics | Acquisition and fulfillment economics |
| Gross Profit | Net Revenue - COGS | Product economics before other variable costs | Whether the order was actually profitable |
| Gross Margin | Gross Profit ÷ Net Revenue | Percentage retained after COGS | Advertising or shipping efficiency |
| Shipping Cost | Fulfillment / delivery expense attributable to sale | Delivery economics | Product quality or acquisition efficiency |
| Transaction Fees | Fees charged on the transaction | Processing economics | Whether ad spend was efficient |
| Contribution Profit Before Ads | Net Revenue - COGS - Shipping - Transaction Fees - Other Variable Costs | Maximum pool available to fund acquisition and profit | Overall company profitability |
| Advertising Spend | Cost used to acquire customers | Acquisition investment | Whether the resulting sales generated profit |
| Contribution Profit | Contribution Profit Before Ads - Advertising Spend | Economic value left after acquiring and fulfilling the sale | Fixed overhead and full business net income |
| Contribution Margin | Contribution Profit ÷ Net Revenue | Profitability after key variable costs | Complete accounting net income |
| ROAS | Attributed Revenue ÷ Advertising Spend | Revenue efficiency of advertising | Whether the revenue was profitable |
| CAC | Advertising Spend ÷ Customers Acquired | Average acquisition cost | Margin generated by those customers |
| Break-Even CAC | Contribution Profit Before Ads per order | Maximum acquisition cost before contribution reaches zero | Long-term fixed-cost profitability |
| Net Profit | Revenue minus relevant total expenses | Overall business profitability | Which specific variable cost caused the problem |
The most important row is Contribution Profit Before Ads.
Why?
Because it creates the financial ceiling for acquisition.
Suppose a store generates:
Net Revenue = $100
COGS = $35
Shipping = $10
Transaction Fees = $3
Other Variable Costs = $2
Then:
Contribution Profit Before Ads
= $100 - $35 - $10 - $3 - $2
= $50
That means the order has approximately $50 available to absorb customer acquisition expense before contribution reaches zero.
Therefore:
Break-Even CAC = $50
A $15 CAC may be excellent.
A $30 CAC may still be strong.
A $45 CAC leaves only $5.
A $51 CAC pushes the order negative under the simplified model.
That is substantially more actionable than simply saying:
"Our ROAS is 2.2x."
Technical Breakdown & Formulas
Start with realized revenue.
Net Revenue
= Gross Sales
- Discounts
- Refunds
- Other Revenue Reductions
Then calculate contribution before advertising:
Contribution Profit Before Ads
= Net Revenue
- COGS
- Shipping
- Transaction Fees
- Other Variable Selling Costs
Then account for acquisition:
Contribution Profit
= Contribution Profit Before Ads
- Advertising Spend
Finally:
Contribution Margin %
= Contribution Profit / Net Revenue × 100
Variable 1: Net Revenue
Net revenue is the amount of sales value that remains after revenue-reducing events.
For a single $100 order:
Gross Sales = $100
Discount = $10
Refund = $5

Net Revenue = $100 - $10 - $5
Net Revenue = $85
A merchant who uses $100 instead of $85 as the contribution denominator is building the analysis from the wrong base.
This becomes especially important for stores using:
- discount codes,
- automatic discounts,
- bundle promotions,
- post-purchase adjustments,
- partial refunds,
- frequent returns.
The more aggressive the promotion strategy, the more dangerous headline revenue becomes as a profitability proxy.
Variable 2: Product COGS
COGS represents the product-related cost allocated to the units sold.
For a basic example:
Quantity = 2
Unit COGS = $22

Order COGS = 2 × $22
Order COGS = $44
A store can have excellent revenue and still have poor contribution if the product cost consumes too much of the selling price.
That is why contribution analysis must start with accurate cost data.
Variable 3: Shipping
Shipping can destroy contribution margin surprisingly quickly.
Imagine:
Net Revenue = $80
COGS = $24
Shipping = $12
Transaction Fees = $3
Then:
Contribution Before Ads
= $80 - $24 - $12 - $3
= $41
If shipping rises from $12 to $17:
Contribution Before Ads
= $80 - $24 - $17 - $3
= $36
Nothing about the product changed.
Nothing about the advertisement changed.
The same customer still paid $80.
But five dollars of contribution vanished.
At 5,000 orders:
5,000 × $5 = $25,000
That is the hidden power of unit economics.
A $5 change that looks insignificant at order level can become a $25,000 problem at scale.
Variable 4: Transaction Fees
Transaction costs typically have a smaller psychological impact because they are spread across orders.
But they are proportional to transaction volume.
Suppose average transaction-related costs equal $2.50 per order:
1,000 orders × $2.50 = $2,500
At 10,000 orders:
10,000 orders × $2.50 = $25,000
The fact that the amount is "only $2.50 per order" is irrelevant once volume increases.
Variable 5: Advertising Spend
Advertising is usually the most visible acquisition cost, yet merchants often analyze it independently from the rest of the cost structure.
That is backwards.
The maximum rational acquisition cost depends on what the order can contribute before advertising.
A useful threshold is:
Break-Even CAC
= Contribution Profit Before Ads
For example:
Net Revenue = $70
COGS = $25
Shipping = $8
Transaction Fees = $2

Contribution Before Ads
= $70 - $25 - $8 - $2
= $35
Therefore:
Break-Even CAC = $35
If CAC is $20:
Contribution After Ads = $35 - $20
= $15
If CAC is $35:
Contribution After Ads = $0
If CAC reaches $40:
Contribution After Ads = -$5
At that point, additional first-order sales are negative contribution under the simplified model.
Variable 6: ROAS
ROAS is:
ROAS = Attributed Revenue / Advertising Spend
Suppose:
Revenue = $10,000
Ad Spend = $2,500

ROAS = $10,000 / $2,500
ROAS = 4.0x
That sounds excellent.
But now calculate contribution before ads.
Suppose:
COGS = $3,500
Shipping = $1,200
Transaction Fees = $300
Other Variable Costs = $200
Then:
Contribution Before Ads
= $10,000
- $3,500
- $1,200
- $300
- $200

= $4,800
After advertising:
Contribution After Ads
= $4,800 - $2,500
= $2,300
The campaign is profitable under the simplified model.
But compare that with a store whose costs are only slightly higher:
COGS = $4,200
Shipping = $1,500
Transaction Fees = $400
Other Variable Costs = $300
Ad Spend = $2,500
Revenue = $10,000
Then:
Contribution Before Ads
= $10,000
- $4,200
- $1,500
- $400
- $300

= $3,600
After ads:
Contribution After Ads
= $3,600 - $2,500
= $1,100
The ROAS remains exactly 4.0x.
The economic result has been cut by more than half.
That is why ROAS should be treated as a marketing efficiency metric, not as a standalone profitability metric.
The Scaled Financial Impact (What It Actually Costs You)
Consider a Shopify store selling a product for $75.
The merchant currently sees:
Average Selling Price = $75
Average COGS = $25
Average Shipping = $8
Average Transaction Fees = $2
So:
Contribution Before Ads
= $75 - $25 - $8 - $2
= $40
This creates a break-even acquisition threshold of:
Break-Even CAC = $40
Now consider three advertising scenarios.
Scenario A: $15 CAC
Contribution After Ads
= $40 - $15
= $25
Contribution margin:
$25 / $75 × 100
= 33.33%
The store retains approximately $25 of contribution per order under this model.
At 100 orders:
100 × $25 = $2,500
At 1,000 orders:
1,000 × $25 = $25,000
At 5,000 orders:
5,000 × $25 = $125,000
Scenario B: $30 CAC
Contribution After Ads
= $40 - $30
= $10
Contribution margin:
$10 / $75 × 100
= 13.33%
At 100 orders:
100 × $10 = $1,000
At 1,000 orders:
1,000 × $10 = $10,000
At 5,000 orders:
5,000 × $10 = $50,000
The store can therefore generate 5,000 orders and still produce $50,000 of contribution under this simplified model.
Now look at what happened compared with Scenario A.
$125,000 - $50,000 = $75,000
A $15 increase in acquisition cost produced a $75,000 reduction in contribution across 5,000 orders.
Nothing about the selling price changed.
Nothing about COGS changed.
Nothing about shipping changed.
The only change was acquisition cost.
That is why contribution margin is so important for ad scaling.
Scenario C: $42 CAC
Now advertising exceeds the break-even threshold.
Contribution After Ads
= $40 - $42
= -$2
The merchant is now approximately $2 negative per order under the simplified variable-cost model.
At 100 orders:
100 × -$2 = -$200
At 1,000 orders:
1,000 × -$2 = -$2,000
At 5,000 orders:
5,000 × -$2 = -$10,000
This is where scaling becomes dangerous.
The marketing platform sees more conversions.
The Shopify store sees more revenue.
The advertising dashboard may still display acceptable headline performance.
But under the contribution model, every additional order increases the variable loss.
The merchant is effectively paying to manufacture revenue.
The uncomfortable conclusion
There is no magical ROAS number that guarantees profitability for every Shopify store.
A 2.5x ROAS can be excellent for one business and disastrous for another.
A 4.0x ROAS can be highly profitable for one product and nearly worthless for another.
The relevant question is:
How much contribution does each order generate
before acquisition cost?
Only after that number is known can the merchant establish a rational CAC ceiling.
Strategic Execution (How to Apply This to Your Business)
Step 1: Calculate Contribution Before Ads for Every Important SKU
For every major product or variant, calculate:
Net Revenue
- COGS
- Shipping
- Transaction Fees
- Other Variable Costs
= Contribution Before Ads
Do not use the store-wide average if product economics differ materially.
A $20 product and a $100 product should not automatically inherit the same acquisition threshold.
Step 2: Convert Contribution Into a CAC Ceiling
Once contribution before advertising is known:
Break-Even CAC = Contribution Before Ads
Then establish a target CAC below that number.
For example:
Break-Even CAC = $40

Target CAC = $25
Warning Zone = $30-$35
Critical Zone = $36+
The exact thresholds depend on the store's objectives and the fixed-cost structure.
The point is to create a decision framework rather than reacting emotionally to daily ad fluctuations.
Step 3: Build Separate Targets for Different Products
Suppose a store sells three products:
| Product | Contribution Before Ads | Break-Even CAC | Target CAC |
|---|---|---|---|
| Product A | $18 | $18 | $10 |
| Product B | $35 | $35 | $22 |
| Product C | $52 | $52 | $32 |
A single store-wide CAC target of $25 would create very different outcomes.
At $25 CAC:
Product A = $18 - $25 = -$7
Product B = $35 - $25 = +$10
Product C = $52 - $25 = +$27
One campaign could therefore be profitable on Product C and destructive on Product A even if the acquisition number looks identical.
Step 4: Monitor Contribution, Not Just ROAS
Your advertising dashboard should answer:
How much did we spend?
How much revenue did it generate?
How many customers did it acquire?
Your profitability system needs to answer:
How much contribution did those orders create?
Which products generated it?
Which orders lost money?
Which channels produced the strongest contribution?
This is the difference between marketing reporting and financial decision-making.
Step 5: Track Profitability by Order
An average can hide the problem.
Imagine 100 orders:
60 orders × +$20 contribution = +$1,200
40 orders × -$10 contribution = -$400
Total:
+$800
Average:
$800 / 100 = $8
The store may report:
"Average contribution = $8 per order."
That is mathematically true.
But strategically incomplete.
Forty percent of the orders are negative.
The merchant now needs to identify why:
- expensive shipping zones,
- large discounts,
- high-return products,
- high CAC cohorts,
- low-margin variants,
- unusual order sizes,
- high-fee payment methods,
- poor campaign targeting.
Order-level profitability turns an average into a diagnostic system.
Step 6: Separate Acquisition Efficiency From Profitability
A campaign can have:
High ROAS + Low Contribution
or:
Lower ROAS + Higher Contribution
The second campaign can be the better business decision.
For example:
| Campaign | Revenue | Ad Spend | ROAS | Contribution Before Ads | Contribution After Ads |
|---|---|---|---|---|---|
| Campaign A | $10,000 | $2,500 | 4.0x | $3,400 | $900 |
| Campaign B | $8,000 | $2,500 | 3.2x | $4,600 | $2,100 |
Campaign A has the better ROAS.
Campaign B creates more contribution.
If the company's objective is actual profit creation, Campaign B deserves much more attention.
Step 7: Use Channel-Level Economics
Do not treat all paid traffic as one bucket.
Analyze:
Meta
Google
TikTok
Other acquisition channels
Then compare:
Spend
Revenue
CAC
ROAS
Contribution
Contribution Margin
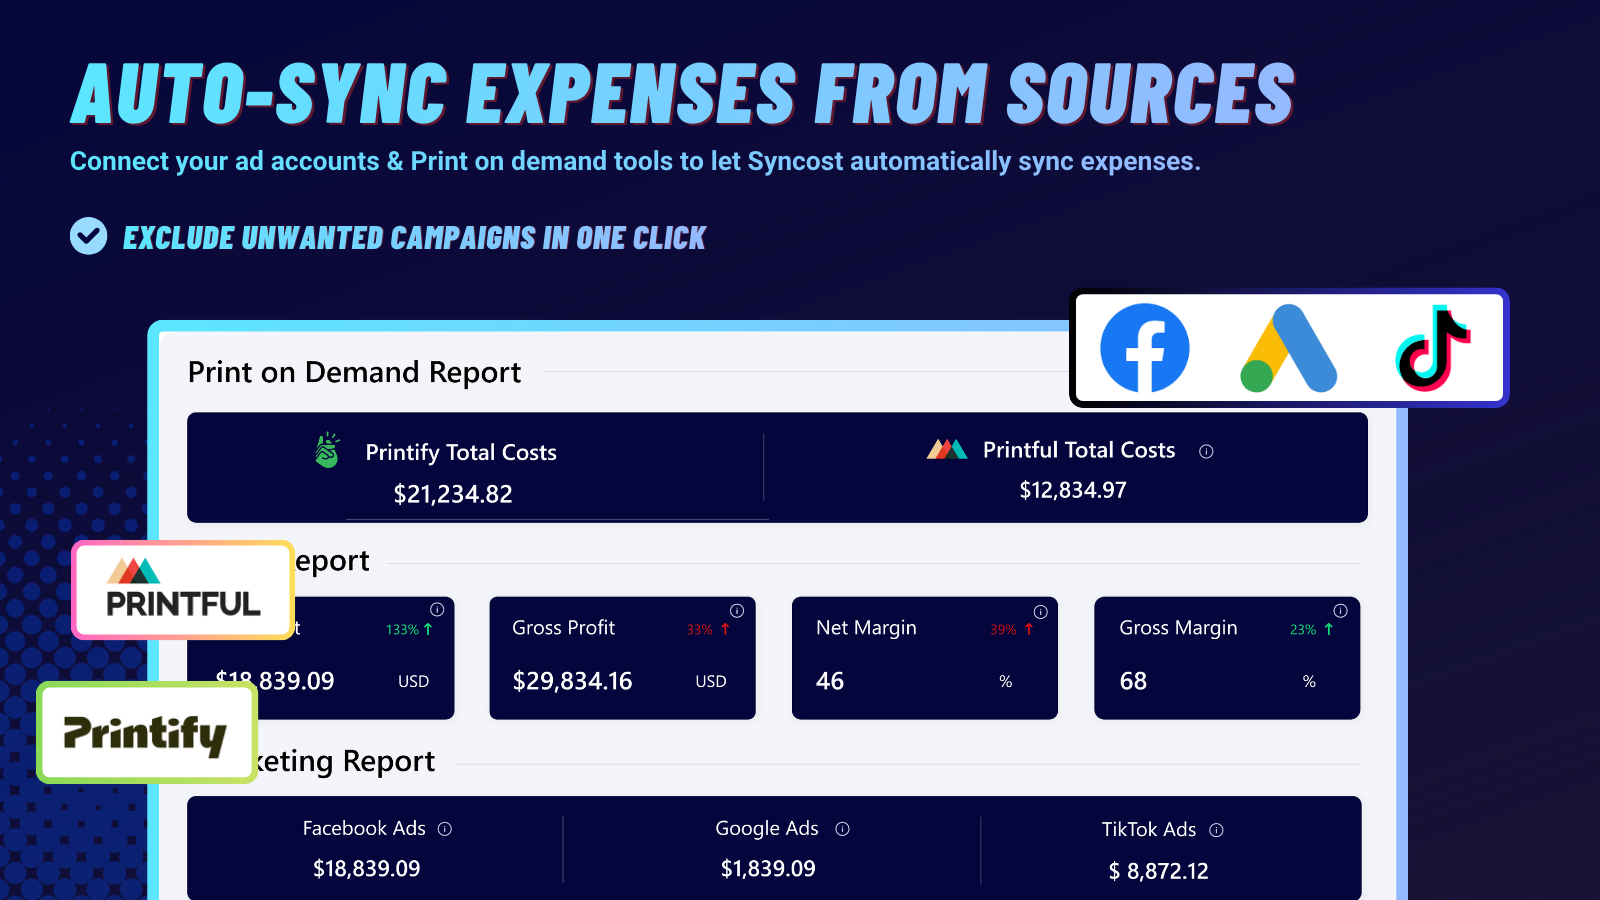
Syncost's current Shopify App Store listing supports ad-spend synchronization from Meta, TikTok, and Google, while its analytics features include ROAS, profit insights, order-level profitability, and real-time tracking.
That matters because your acquisition platforms know what they charged you.
Your store knows what customers purchased.
Your cost model knows what the products, shipping, and transaction processing cost.
Profitability exists in the intersection of those datasets.
Step 8: Account for Fixed Costs Separately
Contribution margin is not net profit.
This distinction matters.
Suppose monthly contribution is:
$50,000
But fixed operating expenses are:
Rent = $5,000
Software = $2,000
Payroll = $20,000
Professional Services = $3,000
Other Fixed Costs = $5,000
Then:
Net Profit Before Other Adjustments
= $50,000 - $35,000
= $15,000
Contribution tells you whether your sales engine is economically productive.
Net profit tells you whether the entire business structure is producing earnings.
You need both.
Step 9: Use Contribution Margin for Promotion Decisions
Discounting a product by $10 does not merely reduce revenue by $10.
It can reduce contribution by almost the entire $10 unless the promotion meaningfully increases volume, average order value, conversion rate, repeat value, or another economic driver.
Consider:
Original Net Revenue = $75
Contribution Before Ads = $40
A $10 discount makes:
Net Revenue = $65
Contribution Before Ads ≈ $30
The merchant has just cut contribution by 25%.
That promotion may still be rational.
But it should be evaluated using economics, not merely conversion rate.
Step 10: Automate the Data Collection
The biggest operational enemy of contribution analysis is not the formula.
The formulas are simple.
The problem is keeping all of the inputs synchronized.
A typical manual workflow might involve:
Shopify orders
+
Product costs
+
Shipping invoices
+
Ad platform exports
+
Transaction fees
+
Recurring expenses
+
Refunds
+
Spreadsheet formulas
=
"Profit"
Every manual handoff is another opportunity for:
- stale data,
- duplicated expenses,
- missing costs,
- broken formulas,
- mismatched date ranges,
- incorrect attribution,
- forgotten refunds,
- outdated COGS.
Syncost is designed to centralize these inputs. The Shopify App Store listing describes real-time profit tracking, P&L reporting, COGS and custom-cost management, shipping-cost rules, order-level profit alerts, historical data, and integrations with major advertising and POD platforms.
Its website also describes automated P&L reporting, order profitability, custom recurring costs, shipping setup, and a unified view combining Shopify, advertising, and fulfillment-related data.
Frequently Asked Questions (FAQ)
What is contribution margin for a Shopify store?
Contribution margin measures how much of the store's realized revenue remains after variable costs required to produce and sell the order.
A simplified formula is:
Contribution Margin %
=
(Net Revenue
- COGS
- Shipping
- Transaction Fees
- Other Variable Costs
- Advertising)
÷ Net Revenue
× 100
It is more decision-oriented than gross margin when the question involves advertising, promotions, fulfillment, or scaling because those decisions are affected by the costs that occur beyond product COGS.
What is a good contribution margin for ecommerce?
There is no universal percentage that makes a Shopify store "good."
The appropriate target depends on:
- product category,
- pricing,
- fulfillment model,
- return rates,
- customer acquisition costs,
- repeat-purchase behavior,
- fixed operating expenses,
- business maturity.
A store with a 15% contribution margin can have a healthy business if acquisition is predictable and customers repeat.
A store with a 40% contribution margin can still struggle if CAC is volatile, refunds are high, overhead is excessive, or working capital is constrained.
The useful question is not:
"Is 20% good?"
It is:
"Does this contribution level adequately fund customer acquisition, operating expenses, risk, and the owner's required return?"
What is the break-even CAC for Shopify advertising?
A practical simplified formula is:
Break-Even CAC
=
Contribution Profit Before Advertising
Example:
Net Revenue = $80
COGS = $25
Shipping = $10
Transaction Fees = $3

Contribution Before Ads = $42
Therefore:
Break-Even CAC = $42
At $42 CAC, contribution reaches approximately zero under this simplified model.
Your actual target should generally be below break-even because the business still needs to support broader expenses and profit goals.
Why can a Shopify store have good ROAS but poor profit?
Because ROAS only compares attributed advertising revenue with advertising spend.
It does not inherently account for all other costs in the sale.
Two stores can both report:
ROAS = 3.0x
while having completely different:
COGS
Shipping
Transaction Fees
Refund Rates
Discounts
Fulfillment Costs
Contribution Margins
The store with the higher variable-cost structure can therefore generate much less contribution from the same ROAS.
ROAS answers:
"How efficiently did my advertising generate attributed revenue?"
Contribution analysis answers:
"How much economic value did those sales actually create after the variable costs?"
You need both questions answered to manage acquisition intelligently.
From Financial Chaos to Verified Profit
The dangerous part of ecommerce is not that merchants lack metrics.
It is that merchants can have the wrong metric in the most visible position.
Revenue is visible.
Orders are visible.
ROAS is visible.
Ad spend is visible.
But the number that matters for sustainable scaling sits deeper:
What remains after the costs required to make the sale happen?
That is contribution.
And once contribution is known, the business can answer much better questions.
Instead of:
"Can we increase the ad budget?"
You can ask:
"How much contribution does the average order create before advertising?"
Instead of:
"Is this campaign's ROAS good?"
You can ask:
"What contribution did this campaign generate after acquisition?"
Instead of:
"Can we afford a $10 discount?"
You can ask:
"How much contribution are we sacrificing, and what additional conversion or order volume must that discount generate to justify it?"
Instead of:
"Which product sells the most?"
You can ask:
"Which product creates the most contribution after all variable costs?"
That is the difference between marketing analytics and profit analytics.
Syncost is built around that deeper layer.
Its current Shopify App Store listing describes a real-time profit tracker that combines ad spend, COGS, Shopify fees, shipping, recurring costs, order-level profitability, product-level margins, daily performance, and P&L reporting. It integrates with Shopify, Facebook Ads, Google Ads, TikTok Ads, Printful, and Printify.
The platform also includes configurable shipping costs, custom cost categories, COGS management, order-level gross-profit alerts, historical data, and P&L capabilities across its paid tiers.
That is important because contribution analysis is only as accurate as the costs feeding it.
A perfect formula with stale COGS is still wrong.
A perfect ROAS number with missing shipping is still incomplete.
A perfect order count with unaccounted transaction fees is still financially misleading.
The goal is therefore not merely to have more dashboards.
The goal is to have one coherent economic model of the store.
A practical model looks like this:
Shopify Revenue
       ↓
Refunds & Discounts
       ↓
Net Revenue
       ↓
COGS
       ↓
Shipping
       ↓
Transaction Fees
       ↓
Other Variable Costs
       ↓
Contribution Before Ads
       ↓
Advertising Spend
       ↓
Contribution Profit
       ↓
Operating Expenses
       ↓
Net Profit
Each layer answers a different question.
Net Revenue tells you what the store actually generated in sales value.
Gross Profit tells you what remains after product cost.
Contribution Before Ads tells you how much economic room exists to acquire the customer.
Contribution Profit tells you whether the acquisition and fulfillment system is generating value.
Net Profit tells you whether the entire business structure is economically sustainable.
That hierarchy is what turns profitability from a vague monthly feeling into a decision framework.
Because a store does not become healthier simply because its revenue graph goes up.
It becomes healthier when the economics underneath that revenue improve.
And when you know exactly how much each order contributes, you stop asking whether you can afford to scale.
You know how far you can scale before the numbers break.