The Landed COGS Illusion: Why Your E-Commerce Gross Margin is a Dangerous Lie
Most e-commerce operators calculate their gross margin using the factory invoice price, creating a dangerous "phantom profit." Discover how ignoring fully burdened landed costs—like freight, import duties, and drayage—artificially inflates your margins, causes you to overspend on customer acquisition, and silently drains your operating cash flow.

The Hook & The Silent Problem
You are reviewing your monthly P&L. Your hero product sells for $120. Your supplier in Shenzhen charges you $24 per unit. You do the quick mental math: an $96 gross profit, yielding a massive 80% gross margin. With numbers like that, you tell your media buyer to scale the Meta ad spend, comfortable paying up to $50 in Customer Acquisition Cost (CAC) while still netting a healthy profit.
Six months later, your revenue has doubled, but your bank account is dangerously close to zero. How did you scale yourself into a cash flow crisis?
The answer lies in the single most common, yet catastrophic, financial error in direct-to-consumer (DTC) e-commerce: pricing and scaling based on the factory invoice price instead of the fully burdened landed cost. By using only the base factory cost, founders routinely understate their Cost of Goods Sold (COGS) by 10% to 20%.
When you scale ad spend based on an 80% "phantom margin," you aren't just cutting into your profits—you are actively subsidizing every sale out of your own working capital. Your true margin was eaten alive at the port, at customs, and at the receiving dock, long before the customer ever clicked "Add to Cart."
Core Concept Explained (The Quick Answer)
Base COGS (or EXW/FOB invoice price) is merely the raw manufacturing cost you pay the factory for the physical product. Landed COGS is the fully burdened, true cost of getting that single unit ready for sale on your shelf—including the base cost plus all inbound ocean/air freight, import duties, customs brokerage, drayage fees, marine insurance, and 3PL receiving labor.
The Deep-Dive Reference Guide
To accurately protect your unit economics, you must track the complete supply chain lifecycle of your inventory. If you are missing any of the below line items in your financial model, your gross margin is fundamentally incorrect. In global trade, product cost typically represents only 45% of the total expense, with freight (25%), duties (15%), taxes (10%), and handling fees (5%) comprising the rest of the landed cost.
| Cost Component | Operational Definition | Margin Impact & Danger Zone |
|---|---|---|
| Base Factory Invoice (FOB/EXW) | The strict manufacturing cost paid to the supplier per unit. | The Baseline. Often mistakenly used as the only COGS input, creating a dangerously inflated gross margin. |
| Inbound Freight (Air/Ocean) | The cost to move the goods from the country of origin to your domestic port. | Highly Volatile. Freight rates fluctuate wildly based on seasonality, fuel surcharges, and global container availability. |
| Import Duties & Tariffs | Taxes levied by your government based on the product's HTS (Harmonized Tariff Schedule) code. | Direct Cash Hit. Can range from 0% to 30%+ depending on trade policies and product classification. |
| Port Drayage & Demurrage | The cost of moving the container from the port to your warehouse, plus any delay penalties. | The Hidden Drain. Port congestion can lead to thousands of dollars in surprise demurrage fees that must be allocated per unit. |
| Marine & Cargo Insurance | The premium paid to protect the shipment against loss, theft, or damage at sea. | Incremental Bleed. Usually 1-3% of the commercial invoice value, but frequently omitted from unit economics. |
| 3PL Receiving & QC Prep | Warehouse labor fees for unloading floor-loaded containers, palletizing, and quality control checks. | The Final Mile Cost. Often buried in monthly OpEx, but must be capitalized into the unit's inventory value. |
Technical Breakdown & Formulas
Calculating True Landed COGS requires moving away from back-of-the-napkin math and implementing strict, unit-level cost allocation.
The Fully Burdened Landed COGS Formula:
Landed_COGS_Per_Unit = Base_Unit_Cost + (Total_Freight / Total_Units) + (Total_Duties / Total_Units) + (Total_Insurance / Total_Units) + (Total_3PL_Receiving / Total_Units)

Where:
- Base_Unit_Cost: The per-unit price listed on your supplier's commercial invoice.
- Total_Freight: The cumulative invoice from your freight forwarder (including origin fees, ocean freight, destination fees, and drayage).
- Total_Duties: The exact customs bill paid to your broker.
- Total_3PL_Receiving: The labor bill for unloading, palletizing, and inspecting that specific shipment.

True Gross Margin Formula (Landed):
True_Gross_Margin_% = ((Net_Revenue - Landed_COGS_Per_Unit - Payment_Gateway_Fees) / Gross_Revenue) * 100
Notice the inclusion of Payment_Gateway_Fees in the True Gross Margin calculation. Payment processors take a top-line cut (typically 2.9% + $0.30) that you never actually see. Subtracting this alongside Landed COGS gives you your absolute ceiling for customer acquisition and fixed overhead.
The Scaled Financial Impact (What It Actually Costs You)
Let’s examine exactly how the Landed COGS illusion destroys working capital at scale. We will look at a premium travel backpack selling for $150.00.
The Illusion (Using Base COGS)
- Retail Price: $150.00
- Base Factory Invoice: $35.00
- Perceived Gross Profit: $115.00 (76.6% Margin)
- Target CAC: The founder sets a target CAC of $65.00, believing they will still clear $50.00 in pure profit per bag.
The Reality (The Landed COGS Breakdown)
- Base Factory Invoice: $35.00
- Inbound Ocean Freight (Allocated per unit): $8.50
- Import Duties (17.6% HTS code classification): $6.16
- Port Drayage & Marine Insurance: $1.20
- 3PL Container Unload & Palletizing: $1.85
- True Landed COGS: $52.71
- Shopify Payment Gateway Fee (2.9% + $0.30): $4.65
- Actual Gross Profit Available for Marketing: $92.64 (61.7% Margin)
The Catastrophic Math at Scale
If the founder scales the brand to 5,000 units a month while aggressively spending up to their $65.00 CAC target:
- Expected Profit (The Illusion): 5,000 units × $50.00 profit = +$250,000 / month
- Actual Profit (The Reality): 5,000 units × ($92.64 True Gross Profit - $65.00 CAC) = +$138,200 / month
The founder has silently "lost" $111,800 in a single month ($1,341,600 annualized) simply because they priced their marketing efficiency against their factory invoice rather than their true landed cost.
Strategic Execution (How to Apply This to Your Business)
Stopping this financial bleed requires strict operational discipline and a realignment of how your accounting interacts with your marketing data.
-
Perform a Historical Landed Cost True-Up: Audit your last 3 shipments. Pull the commercial invoices, freight forwarder bills, and customs receipts for your three most recent shipments. Add every penny spent moving the goods and divide by the total received sellable units. Compare this true landed number against the COGS currently sitting in your Shopify backend.
-
Hardcode Landed COGS into Shopify: Update your e-commerce platform. Stop putting the factory invoice price in the Shopify "Cost per item" field. You must update this field to reflect the fully burdened Landed COGS. This ensures that any baseline profit reports generated by the platform are grounded in reality, not fantasy.
-
Recalculate your Break-Even ROAS/CPA: Adjust your marketing targets. Once you know your true Landed COGS, you must immediately lower your target CAC or raise your target ROAS. If your Landed COGS is $15 higher than your Base COGS, you have $15 less to spend on Meta and Google to acquire a customer. Inform your media buying team of the new, stricter efficiency targets.
-
Implement a 5% Freight Volatility Buffer: Protect your margin from volatility. Global supply chains are unstable. Today's $4,000 ocean container could cost $7,500 next quarter. When calculating Landed COGS for future pricing decisions, add a 5% buffer to your freight and duty estimates to insulate your net margins against sudden macro-economic shocks.
Frequently Asked Questions (FAQ)
How often should I update my Landed COGS?
You should recalculate your Landed COGS every time a new shipment arrives at your 3PL. Because freight rates, fuel surcharges, and currency exchange rates fluctuate constantly, relying on a static Landed COGS calculated six months ago will lead to inaccurate margin reporting today.
Should I include marketing inserts and branded packaging in Landed COGS?
Yes. Anything that is a direct, variable cost required to make the unit ready for shipment to the end consumer should be capitalized into the COGS. If your polybag costs $0.45 and your thank-you card costs $0.15, that $0.60 must be added to your Landed COGS calculation.
How do I handle air freight versus ocean freight in my margin calculations?
Air freight can easily be 4x to 6x more expensive per unit than ocean freight. If you air-freight 20% of your inventory to prevent a stockout and ocean-freight the remaining 80%, you should not create a single "average" COGS. You must track the exact inventory batches using First-In-First-Out (FIFO) accounting; otherwise, you will severely overstate your profit during the weeks you are selling the expensive air-freighted units.
Are 3PL pick-and-pack fulfillment fees part of Landed COGS?
No. Standard accounting principles dictate that costs incurred to receive and prep inventory for storage are part of Landed COGS (an asset). However, outbound pick-and-pack fulfillment fees and outbound shipping labels (shipping to the customer) are considered operating expenses (OpEx) or fulfillment costs, not COGS, because they are incurred only at the moment of sale.
From Financial Chaos to Verified Profit
Operating a modern e-commerce brand on spreadsheets and static "factory cost" assumptions is a guaranteed path to margin compression and cash flow crises. When you scale ad spend without knowing exactly how freight, duties, payment fees, and drayage have eroded your unit economics, you are flying blind.
You cannot out-market bad unit economics, and you cannot fix what you do not accurately track.
This is why top-tier DTC operators rely on Syncost.
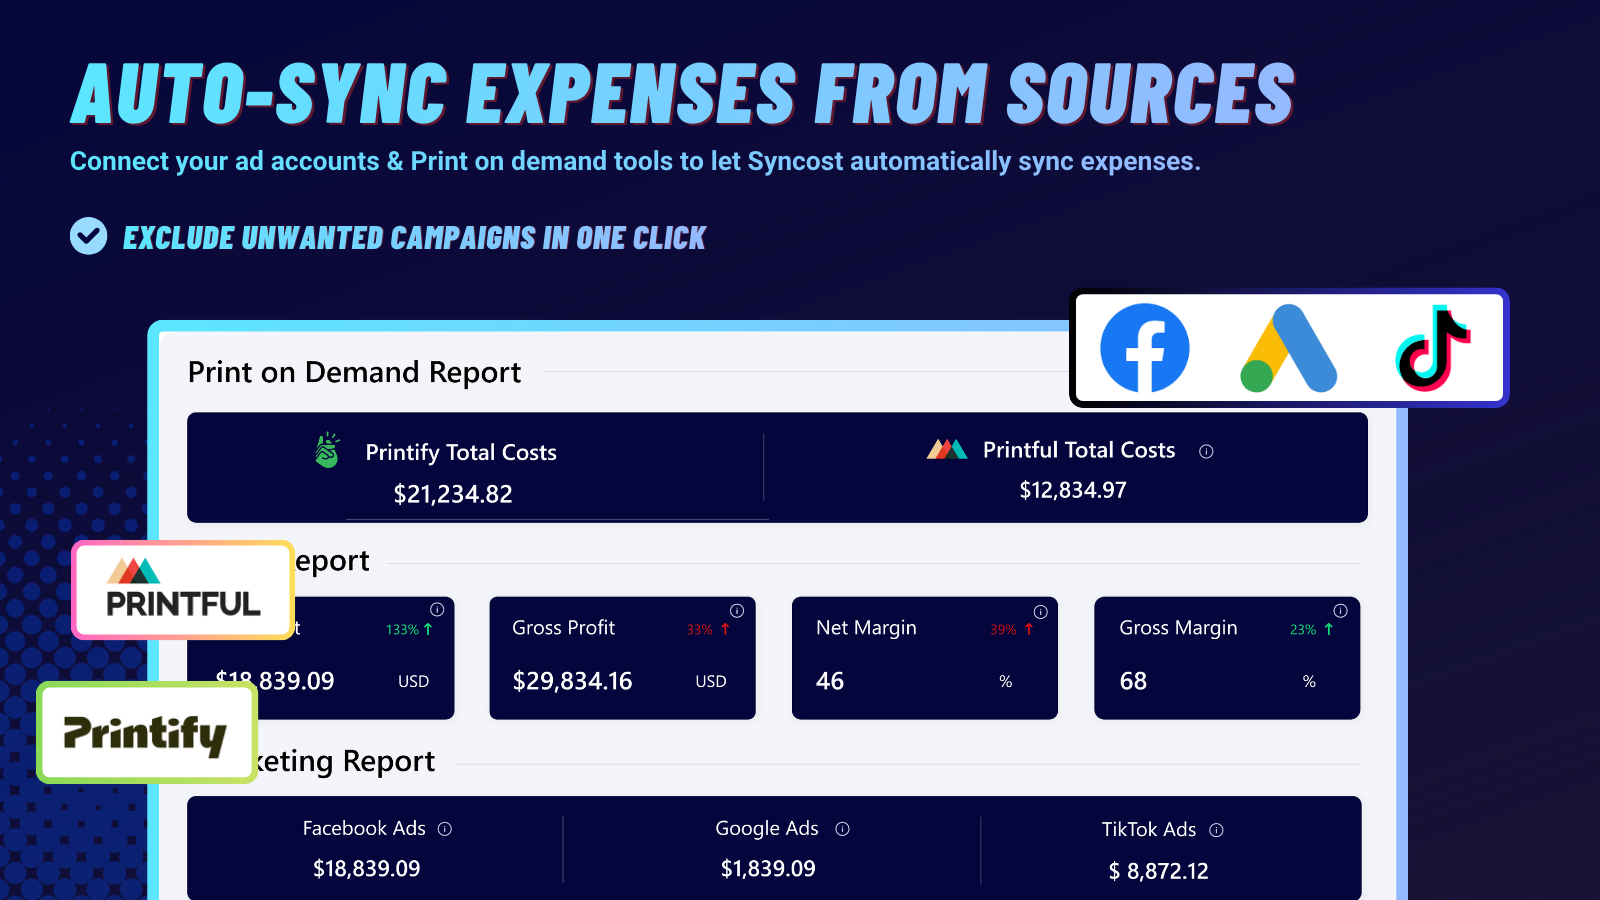
Syncost replaces dangerous guesswork with absolute, bottom-up financial truth. By pulling data directly from your Shopify store, ad platforms, and custom cost inputs, Syncost automates the complex math of True Landed COGS, dynamic payment gateway fees, and real-time ad spend. It delivers a real-time, profit-tracking dashboard that reveals your exact net profit on every single order, down to the penny. Stop scaling on illusionary margins, eliminate hidden supply chain leaks, and take total control of your profitability today.