The Contribution Margin Fallacy: Why Gross Profit is Bankrupting Your Shopify Store
Most Shopify founders calculate profitability by simply subtracting product costs from revenue, blinding themselves to the hidden variable costs that destroy true scale. Discover why understanding true contribution margin is the only way to safeguard your cash flow.

The Hook & The Silent Problem
It is the end of the quarter, and your Shopify analytics dashboard is flashing impressive numbers. You look at your gross revenue: $250,000. You look at your product manufacturing costs (COGS): $50,000. Substracting the two leaves you with $200,000 in gross profit—an 80% margin. To an outside observer, or an inexperienced founder, your business is an absolute cash machine. You feel wealthy, secure, and ready to triple your ad spend and hire five new people.
Then, you check your operating bank account. The balance is dwindling. How is it possible to have an 80% gross profit margin while struggling to make payroll?
The answer lies in one of the most dangerous and widespread delusions in direct-to-consumer commerce: The Contribution Margin Fallacy.
Most merchants believe that if they buy a product for $10 and sell it for $50, they have $40 of profit to play with. They completely ignore the silent army of variable expenses that latch onto every single order the moment a customer clicks "checkout." Payment gateway fees, 3PL pick-and-pack charges, outbound shipping labels, packaging materials, customs duties, return processing, and platform transaction fees carve away at your margins long before you ever pay your fixed overhead or your ad agency.
When you scale volume without understanding your true contribution margins, you aren't growing a profitable enterprise—you are simply subsidizing an expensive machine that turns dollar bills into ninety-cent pieces, faster and faster.
Core Concept Explained (The Quick Answer)
Gross Profit is simply total revenue minus the direct cost of manufacturing or purchasing the physical inventory. Contribution Margin, by contrast, measures the profitability of an individual unit or order after stripping away all variable costs directly tied to its fulfillment and sale (such as shipping, gateway fees, and packaging), providing the true foundation required to cover fixed operating expenses and generate net income.
The Deep-Dive Reference Guide
To eliminate financial blind spots, you must separate your financial tracking into distinct tiers of profitability. Each tier reveals a different layer of operational health.
| Profit Tier | What It Measures | What It Includes | What It Ignores | The Danger of Ignoring It |
|---|---|---|---|---|
| Gross Profit | Raw product markup. | Total Revenue minus Landed COGS (manufacturing, freight to warehouse, duties). | Shipping, packaging, merchant fees, ad spend, operational overhead. | Causes founders to think they have massive margins when variable costs eat 60% of revenue. |
| Contribution Margin 1 (CM1) | Product profitability after sales channels and transaction friction. | Gross Profit minus Payment Gateway Fees (e.g., Shopify Payments, PayPal) and Marketplace/Platform Fees. | Fulfillment, 3PL labor, outbound shipping, marketing. | Fails to account for physical logistics weight and fulfillment center labor inflation. |
| Contribution Margin 2 (CM2) | True operational unit economics. | CM1 minus 3PL Pick-and-Pack fees, Outbound Shipping, Packaging Materials, and Return Processing. | Fixed monthly OpEx (software, salaries) and Advertising Spend. | The Scale Trap. Scaling ad spend when CM2 is razor-thin guarantees compounding losses. |
| Net Operating Profit | Ultimate business viability. | CM2 minus Total Advertising Spend and Fixed Operating Expenses (OpEx). | Non-operating expenses (rarely applicable, but core baseline). | Absolute cash flow insolvency if fixed overhead outpaces true operational earnings. |
Technical Breakdown & Formulas
Calculating true contribution margins requires an uncompromising, bottom-up formulaic approach that accounts for every dollar leaking out of your order fulfillment loop.
The Gross Profit Formula (The Incomplete Baseline):
Gross_Profit = Total_Shopify_Revenue - Total_Landed_COGS

Where:
- Total_Landed_COGS: Unit purchase price + international freight + customs tariffs + warehousing inbound prep.

The Contribution Margin 1 (CM1) Formula:
CM1 = Gross_Profit - (Total_Shopify_Revenue * Gateway_Fee_Percentage)

Where:
- Gateway_Fee_Percentage: The blended percentage taken by credit card processors and wallet solutions (typically 2.4% to 3.5% + fixed transaction fees).

The Contribution Margin 2 (CM2) Formula (The True Scale Metric):
CM2 = CM1 - Total_Variable_Fulfillment_Costs

Where:
- Total_Variable_Fulfillment_Costs: (Orders * Pick_Pack_Fee) + (Orders * Average_Postage_Cost) + (Orders * Packaging_Unit_Cost) + (Refund_Rate_Factor).

The Net Operating Profit Formula:
Net_Profit = CM2 - (Total_Marketing_Spend + Fixed_Monthly_OpEx)
Why these formulas break traditional accounting: If your store sells a product for $100 with a $20 Landed COGS, your Gross Profit is $80 (80%). However, if your payment gateway takes 3%, your 3PL charges $6.50 for pick-and-pack, your postage label averages $7.00, your custom branded box costs $1.50, and 5% of your orders are returned at a $10 processing penalty, your actual CM2 is not $80—it is closer to $59. If you then spend $55 on customer acquisition (CAC) through Meta and Google, your true net profit per order is vanishingly small.
The Scaled Financial Impact (What It Actually Costs You)
Let’s examine how the Contribution Margin Fallacy destroys a growing Shopify brand as order volume scales from a modest 500 orders a month to an aggressive 10,000 orders a month.
Imagine an e-commerce brand selling premium kitchenware at an Average Order Value (AOV) of $120.
- Landed COGS: $30 per unit (25% gross margin on paper? No, 75% gross margin).
- Payment Gateway Fee: 3.2% ($3.84 per order).
- 3PL Fulfillment (Pick, Pack, Postage, Packaging): $11.50 per order.
- Return Rate: 8% (Costing an average of $12 per return across inbound shipping and restocking labor).
Scenario A: Low Volume Baseline (500 Orders / Month)
- Total Revenue: $60,000
- Landed COGS (500 @ $30): $15,000
- Gross Profit: $45,000 (75%)
- Gateway Fees (500 @ $3.84): $1,920
- CM1: $43,080
- Fulfillment & Packaging (500 @ $11.50): $5,750
- Return Processing (40 returns @ $12): $480
- True CM2: $36,850
- Fixed OpEx + Software: $8,000
- Ad Spend: $20,000
- Net Profit: $8,850 (The business is surviving, but margins feel tighter than the 75% gross profit suggested).
Scenario B: The Unchecked Scale Trap (10,000 Orders / Month)
The founder sees the 75% gross profit and decides to aggressively scale ad spend to hit 10,000 orders. However, as volume spikes, their tier-2 fulfillment contract has hidden surcharges, and return rates jump due to broader audience targeting.
- Total Revenue: $1,200,000
- Landed COGS (10,000 @ $30): $300,000
- Gross Profit: $900,000 (Still looks like a massive 75% margin!)
- Gateway Fees (10,000 @ $3.84): $38,400
- CM1: $861,600
- Fulfillment & Packaging (10,000 @ $12.50 due to volume bottlenecks): $125,000
- Return Processing (900 returns @ $14 due to restock friction): $12,600
- True CM2: $724,000
- Fixed OpEx (Expanded team & enterprise software): $35,000
- Ad Spend (Efficiency degrades with scale): $750,000
- Net Profit: -$61,000 (A massive net loss).
The Hidden Disaster: By scaling volume without tracking Contribution Margin 2, the business shipped 10,000 physical orders, managed inventory strain, dealt with customer service queues, spent massive capital on ad platforms, and ended up losing $61,000. The founder was blinded by the $900,000 gross profit figure, completely unaware that variable fulfillment and degraded advertising efficiency had turned scale into a financial hemorrhage.
Strategic Execution (How to Apply This to Your Business)
To break free from the contribution margin fallacy, you must implement a rigorous financial auditing framework across your operations.
-
Map All Variable Costs: Audit every line item. Pull your last 90 days of Shopify orders and itemize every single cost that occurs because an order was placed. Do not rely on estimates. Calculate the exact blended credit card fee, exact 3PL pick-and-pack invoice averages, postage tier distribution, and custom packaging unit costs.
-
Calculate Your True CM2 Break-Even Point: Establish your floor. Determine your exact Contribution Margin 2 percentage. If your CM2 is 45%, every dollar of ad spend must yield an MER (Marketing Efficiency Ratio) that accounts for your fixed overhead. Never scale ad spend if your marginal cost per acquisition exceeds your CM2 dollar value.
-
Negotiate 3PL and Packaging Contracts: Fix logistics leaks. If your CM2 is being crushed by fulfillment fees, audit your warehouse partner. Eliminate redundant packaging materials, negotiate volume-based pick-and-pack fee reductions, and tighten quality control to drive down your return rate.
-
Abandon Manual Spreadsheets: Automate daily tracking. Manual spreadsheets updated at the end of the month are useless for daily media buying decisions. Implement automated tracking that calculates your CM1, CM2, and net profit in real-time, accounting for every refunded order and gateway fee deduction instantly.
Frequently Asked Questions (FAQ)
What is the difference between gross margin and contribution margin in e-commerce?
Gross margin only calculates revenue minus the physical cost of manufacturing the goods (Landed COGS). Contribution margin goes significantly further by subtracting all variable expenses required to execute the sale and fulfill the order, including payment processing fees, 3PL labor, packaging, shipping, and return processing costs.
How do return rates impact my Contribution Margin 2 (CM2)?
Returns are one of the most destructive hidden profit killers in direct-to-commerce. When an item is returned, you lose the outbound shipping fee, pay an inbound return shipping label, absorb warehouse restocking labor costs, and often write off the inventory as open-box or damaged stock. High return rates can instantly turn a healthy CM2 into a negative margin.
Why do Shopify apps and software subscriptions ruin fixed overhead calculations?
Many Shopify merchants accumulate dozens of monthly recurring software subscriptions for upsells, reviews, email marketing, and analytics. While individual apps cost $29 to $299 a month, software subscription creep quietly bloats your fixed operating expenses (OpEx), requiring a higher CM2 output just to reach net operating break-even.
How often should I calculate my Contribution Margin 2?
While strategic financial reviews should happen monthly, your core contribution metrics should be monitored in real-time or via a rolling 7-day average. Because ad spend and fulfillment costs fluctuate daily, waiting until month-end to check your margins means you could be burning cash for weeks without knowing it.
From Financial Chaos to Verified Profit
You cannot out-scale bad unit economics, and you cannot build a resilient e-commerce brand while flying blind on vanity metrics like gross profit. Relying on manual spreadsheets, guessing your blended payment gateway fees, and hoping your 3PL invoices align with your ad dashboards is a recipe for financial distress.
This is precisely why top-tier DTC operators rely on Syncost.
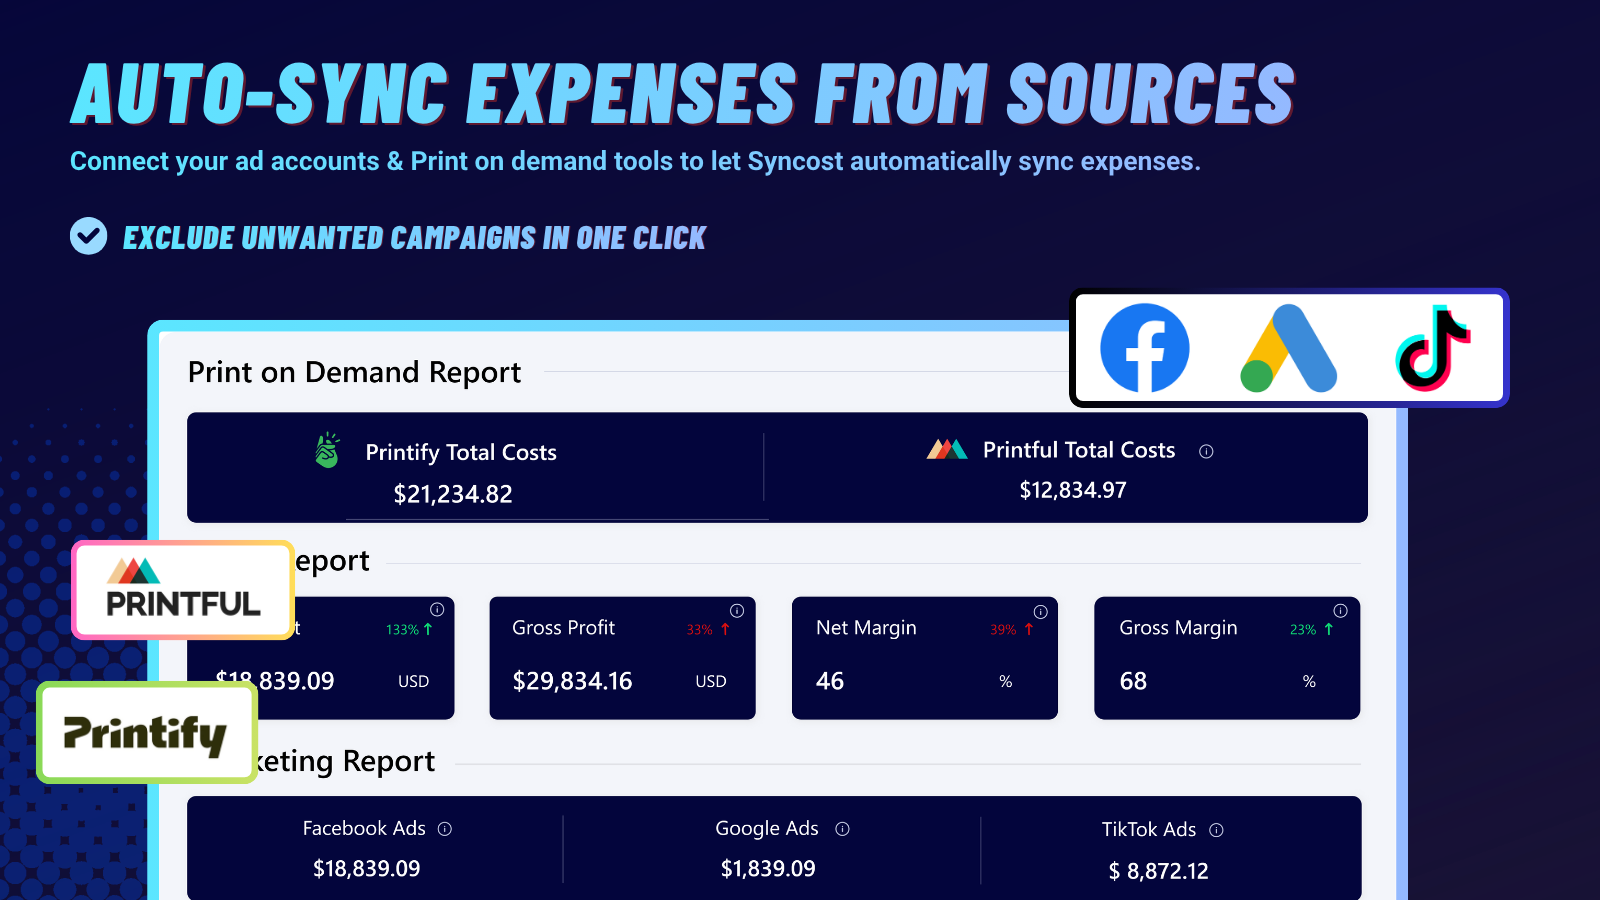
Syncost eliminates the guesswork by integrating directly with your Shopify store, your logistics channels, and your ad accounts. It automatically calculates your exact Contribution Margin 1 (CM1), Contribution Margin 2 (CM2), and True Net Profit in real-time—accounting for live Landed COGS, dynamic payment gateway fees, fulfillment expenses, and multi-channel ad spend down to the exact penny.
Stop letting hidden variable costs drain your bank account while your dashboards tell you you're profitable. Install Syncost, uncover your true operational unit economics, and scale your Shopify brand with absolute financial certainty.