The Blended ROAS Trap: Why MER Is the Only Metric That Matters When You Scale
Stop optimizing individual ad channel ROAS while your total business bleeds cash. Discover why Marketing Efficiency Ratio (MER) is the ultimate metric for multi-channel e-commerce growth and how siloed attribution metrics mask catastrophic ad waste.

The Hook & The Silent Problem
Let’s pull back the curtain on modern media buying and look at the quiet delusion that destroys multi-channel e-commerce brands every single day.
You open your Meta Ads Manager, and it proudly displays a 4.2x Return on Ad Spend (ROAS). You flip over to your Google Ads dashboard, and it claims a 3.8x ROAS on your branded and non-branded search campaigns. Finally, you check your TikTok creator campaigns, and they are flashing a 3.0x ROAS. On paper, according to your isolated dashboards, you are operating an unstoppable growth engine. You feel like a genius media buyer. Every platform is telling you that for every dollar you inject into their ecosystem, they are handing you three to four dollars back in sales.
So, naturally, you scale all three budgets simultaneously.
Yet, at the end of the month, when you log into your Shopify analytics and calculate your total revenue against your total credit card charges for advertising, the math refuses to add up. Your total revenue didn't triple; it barely moved. Meanwhile, your bank balance is plummeting because your actual cash-in versus cash-out is completely detached from what your ad managers are reporting.
Why does this happen? Because ad platforms operate like competing sales reps inside your company—each one aggressively claiming credit for the exact same customer conversion. Meta, Google, and TikTok overlap their attribution windows, double-counting sales, claiming organic traffic, and taking full credit for repeat buyers who would have purchased via your email flows anyway. If you manage your ad spend based on siloed, platform-reported ROAS, you aren't managing a marketing budget—you are falling victim to the Blended ROAS Trap. When you scale individual channels based on inflated vanity metrics, you are simply bidding against yourself and overfunding platforms that are cannibalizing each other's traffic.
Core Concept Explained (The Quick Answer)
Marketing Efficiency Ratio (MER)—often referred to as Blended ROAS—is total store gross revenue divided by total marketing spend across all channels combined. Unlike platform-reported ROAS, which relies on self-serving, overlapping attribution models, MER provides an absolute, unmanipulated financial baseline of how efficiently your entire marketing expenditure is driving overall business growth.
The Deep-Dive Reference Guide
To transition from amateur channel-level optimization to elite, CFO-level multi-channel management, you must understand how fragmented metrics contrast with consolidated financial reality. Review this operational breakdown.
| Metric Type | Platform-Reported ROAS (Meta, Google, TikTok) | Blended Marketing Efficiency Ratio (MER) |
|---|---|---|
| Attribution Model | Self-reported, click/view-through windows set by the ad platform. | Unbiased, mathematical ratio of total revenue to total ad spend. |
| Duplicate Credit | High. Multiple platforms claim credit for the exact same purchaser. | Zero. Revenue is counted once at the store checkout level, regardless of touchpoints. |
| Organic & Retention Blending | Ignores organic search, direct traffic, and email flows; attributes them to paid ads. | Captures the holistic lift of all marketing efforts, including email, SMS, and organic social. |
| Scaling Reliability | Dangerous. Encourages overspending as channels artificially inflate their own performance. | Reliable. Acts as your primary health check to determine if scaling ad spend actually grows the business. |
Technical Breakdown & Formulas
You cannot manage multi-channel media spend with platform-specific guesswork. You must use top-down financial formulas to evaluate your true marketing productivity.
[Formula 1: Marketing Efficiency Ratio (MER)]
MER = Total_Store_Gross_Revenue / Total_Combined_Ad_Spend

[Formula 2: Blended Customer Acquisition Cost (Blended CAC)]
Blended_CAC = Total_Combined_Ad_Spend / Total_New_Customers_Acquired

[Formula 3: MER Break-Even Threshold]
MER_Break_Even = 1 / Gross_Margin_Percentage

[Formula 4: Incremental MER (iMER)]
iMER = Change_in_Total_Revenue / Change_in_Total_Ad_Spend
Total Combined Ad Spend: This includes every single dollar spent across Meta, Google, TikTok, Pinterest, influencer partnerships, and programmatic ads. If money leaves your bank account for marketing, it belongs in this denominator. MER Break-Even Threshold: If your gross margin (after COGS and shipping) is 50%, your break-even MER is $2.00 (1 / 0.50). If your MER drops below 2.00, your entire marketing operation is losing money on every dollar spent, regardless of what any individual ad dashboard claims. Incremental MER (iMER): This is the most critical advanced metric for scaling. It measures whether new ad dollars are actually generating new revenue, or if you have hit the saturation ceiling where dumping more cash into ads yields zero marginal return.
The Scaled Financial Impact (What It Actually Costs You)
Let’s analyze a concrete mathematical scenario to expose how ignoring MER and trusting siloed ROAS destroys a scaling brand.
Assume you operate an e-commerce brand generating $100,000 in monthly revenue. Your total ad spend across Meta and Google is $25,000. Your blended MER is currently 4.0x ($100k revenue / $25k spend). Your gross profit margins are healthy, and the business is thriving.
Encouraged by your individual ad managers—where Meta shows a 4.5x ROAS and Google shows a 4.0x ROAS—you decide to aggressively scale. You double your total ad spend to $50,000 a month.
The Amateur Expectation (Platform Mirage)
Because each ad manager promised high returns, you expect your revenue to double proportionally to $200,000.
The Brutal MER Reality at Scale
When you hit $50,000 in ad spend, audience saturation sets in. Because you didn't track your incremental MER, you poured extra capital into saturated targeting brackets.
- Your total store revenue only climbs to $130,000 (not $200,000).
- Your new Blended MER drops from 4.0x down to 2.6x ($130k revenue / $50k spend).
- More importantly, let's look at your Incremental MER for that extra $25,000 in spend: You spent an additional $25,000 in ads to generate only $30,000 in extra revenue.
- Your iMER on that marginal spend is an abysmal 1.2x ($30k extra revenue / $25k extra spend).
When you factor in your true landed COGS, merchant fees, and fulfillment overhead, generating that $30,000 in extra revenue cost you more in variable expenses and ad spend than the gross profit it returned. You doubled your ad budget, increased your operational strain, and actually decreased your net profit. Siloed ROAS hid the decay while your blended efficiency collapsed.
Strategic Execution (How to Apply This to Your Business)
To strip away platform bias and align your media buying strategy with bottom-line profitability, execute this operational workflow immediately:
-
Calculate Your Baseline Blended MER: Establish your single source of truth. Pull your total store revenue and total combined ad spend across all channels for the last 90 days. Divide revenue by spend to find your true historical MER. Never make a scaling decision based on individual platform ROAS again until your blended baseline is locked in.
-
Enforce a Strict MER Guardrail: Protect your floor margins. Calculate your store's break-even MER based on your true landed COGS and operating expenses. Give your media buying team a hard rule: If scaling a channel pushes the overall company MER below your profitable threshold, budgets must be reallocated immediately, regardless of what the platform's internal dashboard claims.
-
Track Incremental MER During Scale: Measure marginal returns. When testing budget increases, do not look at average MER. Look strictly at incremental MER (the ratio of extra revenue generated by extra ad spend). If your iMER drops below 1.5x, you have hit market saturation. Pumping more money into that channel will burn cash.
-
Consolidate Multi-Channel Reporting: Unify your attribution analytics. Stop tabbing between Meta, Google, and TikTok ad managers. Implement centralized financial tracking that ingests your total ad spend and storefront revenue into a single, unified view so you can monitor your blended efficiency in real-time.
Frequently Asked Questions (FAQ)
What is a healthy Marketing Efficiency Ratio (MER) for an e-commerce brand?
While it varies depending on your product margins and business model, a healthy, sustainable direct-to-consumer (DTC) brand typically targets a Blended MER between 3.0x and 5.0x. If your gross margins are exceptionally high (e.g., digital products or high-markup cosmetics), you can sustain a lower MER. If your product has heavy manufacturing and shipping costs, you will need a higher MER to remain profitable.
Why do ad platforms report higher ROAS than my actual store results?
Ad platforms use attribution windows (such as 7-day click and 1-day view) that overlap with one another. If a customer clicks a Meta ad, searches your brand on Google, and finally buys, both Meta and Google will claim 100% of the credit for that single sale. This attribution overlap artificially inflates platform-reported ROAS by 30% to 50% across the board.
How does MER differ from ROAS?
ROAS (Return on Ad Spend) measures the revenue generated by a single specific ad channel divided by the spend on that channel. MER (Marketing Efficiency Ratio) measures the total revenue of the entire business divided by the total combined ad spend across all marketing channels. MER cannot be manipulated by overlapping platform attribution.
From Financial Chaos to Verified Profit
Trying to scale an e-commerce brand by relying on the self-reported ROAS of individual ad platforms is like navigating a ship by asking competing pirates where north is. Every platform has an incentive to inflate its own numbers, hide attribution overlap, and convince you to hand over more of your working capital. When you manage multi-channel growth without a top-down view of your true efficiency, you inevitably scale yourself into a cash flow crisis.
This is why top-tier merchants rely on Syncost.
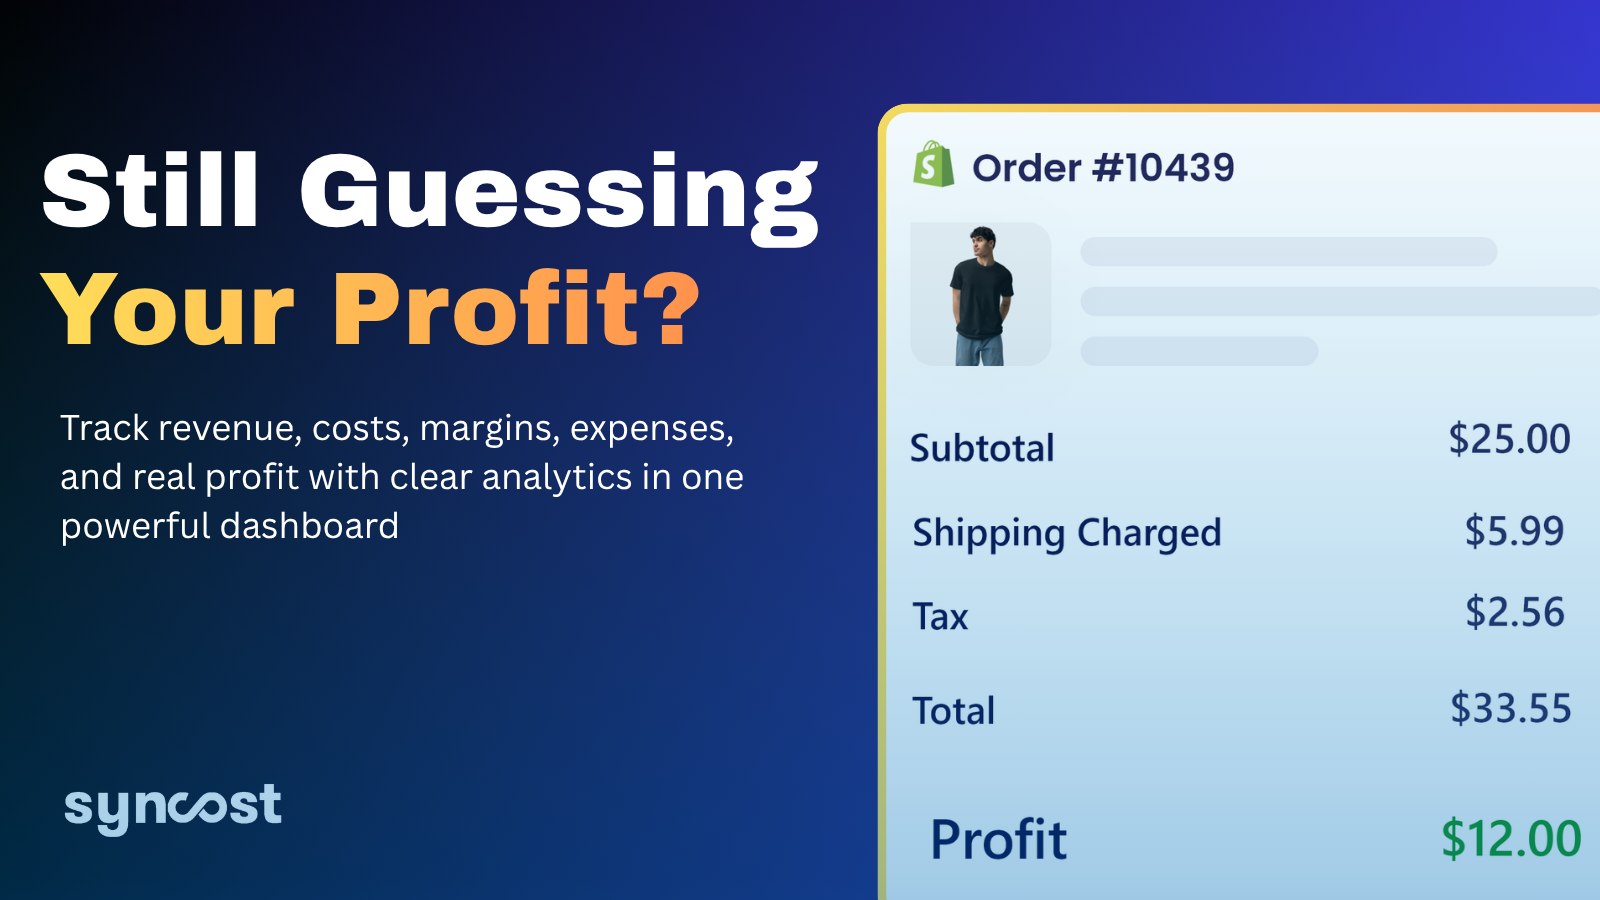
Syncost eliminates the illusions of fragmented ad dashboards by unifying your entire financial ecosystem. It automatically aggregates your total multi-channel ad spend from Meta, Google, TikTok, and more, pairing it instantly with your Shopify gross revenue, landed COGS, and payment gateway fees. Instead of guessing whether your scaling efforts are working, Syncost delivers real-time Blended MER and True Net Profit analytics directly to your dashboard.
Stop letting platform attribution tricks drain your operating cash. Install Syncost today, lock down your Marketing Efficiency Ratio, and scale your brand with absolute, unshakeable financial clarity.