The Return Rate Bleed: Why High Product Returns Silently Bankrupt E-Commerce Stores
Many Shopify merchants celebrate a surge in gross revenue, completely ignoring the toxic undercurrent of a 20% to 30% return rate. Discover why reverse logistics, non-refundable processing fees, and unsellable inventory destroy your net margin, and learn how to calculate your true return-adjusted profitability.

The Hook & The Silent Problem
Let’s be entirely real here and skip the sugar-coating: one of the most destructive illusions in e-commerce is the belief that a product return is a harmless, standard cost of doing business.
You run an apparel, footwear, or home goods store on Shopify. Your ad campaigns are firing on all cylinders, your front-end revenue is climbing, and your daily dashboard flashes green. You look at your total gross sales and feel invincible. But beneath the surface, your return rate is hovering at 25% or 30%. When a customer returns an item, you issue a full refund, thinking you are simply back to square one. You take the item back, restock it (hopefully), and move on.
Except you aren't back to square one. You are actively bleeding cash on every single returned transaction.
Here is the brutal financial reality that standard e-commerce dashboards hide from you: when a customer buys a $100 item and returns it, you don't just lose the sale—you absorb a compounding cascade of hidden expenses. First, you paid to acquire that customer through Meta or Google ads (and the ad platform keeps its money). Second, your payment gateway (whether Stripe or Shopify Payments) keeps its non-refundable transaction processing fee (typically 2.9% plus $0.30). Third, you paid for the outbound shipping to send the item to the customer. Fourth, you now have to pay for the return shipping label. Fifth, your 3PL charges you an inspection, restocking, and repackaging fee. Finally, if the item was opened, tried on, or slightly damaged, you cannot sell it as new; it becomes "open-box" inventory that must be liquidated at a 70% loss.
If your financial tracking relies on top-line gross revenue, a high return rate acts as a slow-acting poison that turns profitable order volume into a devastating net loss. You can scale your top-line sales to seven figures while marching straight toward insolvency.
Core Concept Explained (The Quick Answer)
The Return-Adjusted Net Margin is the true profitability of a product cohort after factoring in the total cost of reverse logistics, non-refundable gateway fees, outbound shipping losses, and inventory depreciation from returned items. To survive at scale, operators must calculate their True Return Cost (TRC) and adjust their pricing and product descriptions to compress return frequencies before scaling ad spend.
The Deep-Dive Reference Guide
To stop bleeding cash on returned orders, you need to understand how amateur accounting methods mask the true damage of reverse logistics. Evaluate your store operations against this CFO-level reality matrix.
| Return Management Metric | Amateur Approach (The Illusion) | The Brutal CFO Reality (Net Impact) | Best Used For |
|---|---|---|---|
| Payment Processing Fees | "I refunded the customer in full, so the transaction cost vanished." | Pure Loss. Payment processors keep their 2.9% + $0.30 fee on the original transaction, and some charge an extra fee to process the refund. | Nothing. This is a direct cash leak on every return. |
| Outbound & Return Shipping | "We offer free shipping and free returns to boost conversion rates." | The Margin Killer. You pay to ship the item out, you pay for the return label, and you recover zero shipping revenue. | Only sustainable if your product gross margins exceed 80%. |
| Warehouse Restocking | "The item came back, so our inventory level is restored." | Labor & Depreciation Drag. 3PLs charge pick, pack, and inspection fees to handle returns, while opened goods lose 30% to 50% of their resale value. | Tracking actual inventory valuation vs. phantom stock. |
| Return-Adjusted Net Profit | Calculating profit strictly on successful, non-returned orders. | The True Financial Baseline. Blends the cost of returns across all orders to reveal whether the brand is actually generating liquid cash. | Every high-AOV or high-return-rate DTC brand scaling via paid media. |
Technical Breakdown & Formulas
You cannot manage a high-volume e-commerce store by treating returns as an afterthought. You must mathematically map the exact cost of every returned item using these core financial formulas.
Step 1: Non-Refundable Processing Fee Loss (NRPFL)
NRPFL_$ = (Original_Retail_Price * Gateway_Percentage) + Gateway_Fixed_Fee

Step 2: Total Reverse Logistics Cost (TRLC)
TRLC_$ = Outbound_Shipping_Cost + Return_Shipping_Label_Cost + 3PL_Inspection_Fee

Step 3: Inventory Depreciation Loss (IDL)
IDL_$ = Initial_Landed_COGS * Return_Depreciation_Percentage

Step 4: The True Return Cost Per Returned Order
True_Return_Cost_$ = NRPFL_$ + TRLC_$ + IDL_$

Step 5: Return-Adjusted Net Profit (RANP)
RANP_$ = Gross_Profit_on_Kept_Orders - (Total_Returns_Count * True_Return_Cost_$) - Blended_CAC
Variable Glossary:
- NRPFL (Non-Refundable Processing Fee Loss): The cash permanently swallowed by your payment gateway when a transaction is completed and then refunded.
- TRLC (Total Reverse Logistics Cost): The combined cost of shipping the item twice and paying your warehouse team to inspect and process the returned package.
- IDL (Inventory Depreciation Loss): The loss incurred when a returned item cannot be restocked as brand new and must be discounted, refurbished, or discarded.
The Scaled Financial Impact (What It Actually Costs You)
Let’s expose the devastating financial impact of a high return rate by analyzing a Shopify brand selling a $100 premium footwear item.
The underlying unit economics before returns:
- Retail Price (AOV): $100.00
- Landed COGS: $30.00
- Outbound Shipping & 3PL Fulfillment: $10.00
- First-Order Gross Margin (Before Ads): $60.00
- Blended Ad CAC: $35.00
- Initial Net Profit Per Kept Order: $25.00
This store has a 25% return rate due to sizing issues. For every 100 orders placed, 75 customers keep their shoes, and 25 customers return them.
The Breakdown of a Single Returned Order
When a customer returns a $100 pair of shoes:
- Lost outbound shipping & 3PL pick/pack: $10.00
- Return shipping label paid by merchant: $8.00
- 3PL return inspection and restocking labor: $5.00
- Non-refundable gateway processing fee (3% + $0.30): $3.30
- Inventory depreciation (shoes worn/box damaged, must be sold open-box at 50% value): $15.00
- Total Cost to Process That Single Return: $41.30 (You lose over $40 every time someone sends an item back).
The Financial Impact at 100 Orders
- 75 Kept Orders * $25.00 net profit = $1,875.00
- 25 Returned Orders * -$41.30 loss = -$1,032.50
- Total Net Profit for the Month: $842.50. (The business is still profitable, but returns wiped out over half of the expected earnings).
The Death Spiral at 5,000 Orders
Encouraged by their top-line revenue, the founder scales ad spend to achieve 5,000 orders a month.
- Gross Orders: 5,000.
- Kept Orders (75%): 3,750 * $25.00 profit = $93,750.00
- Returned Orders (25%): 1,250 * -$41.30 loss = -$51,625.00
- Total Net Profit: $42,125.00.
Wait, the store still made $42k, right? Here is where the operational trap snaps shut: Cash Flow Lag and Reserve Holds.
Because returns take 14 to 30 days to transit back to the warehouse, be inspected, and be processed, the founder spent cash upfront to fulfill all 5,000 orders (including ad spend, COGS, and initial shipping). When 1,250 customers flood the warehouse with returns simultaneously, the merchant is forced to issue refunds out of current operating cash while their payment gateway places rolling reserves on their account due to high refund volatility. The founder experiences a severe cash deficit, unable to cover supplier invoices because cash is trapped in return transit and processing queues.
The Financial Impact: High return rates do not just compress net profit margins; they destroy operational liquidity. When paired with scaling ad spend, unmanaged reverse logistics create a cash flow vacuum that can force a profitable brand into sudden insolvency.
Strategic Execution (How to Apply This to Your Business)
To stop reverse logistics from bleeding your brand dry, implement this strict operational workflow immediately:
-
Calculate Your Return-Adjusted Unit Economics: Audit your true return cost. Export your last 90 days of sales, refunds, gateway fees, and 3PL return invoices. Determine your exact True Return Cost per order. If your return rate exceeds 20% on low-margin products, your scaling strategy is mathematically flawed.
-
Overhaul Product Pages and Sizing Guides: Fix the root cause. Over 65% of returns are driven by mismatched customer expectations or sizing errors. Add interactive sizing widgets, detailed fit videos, and high-resolution material close-ups to your Shopify product pages to stop mismatched purchases before checkout.
-
Implement Restocking Fees or Return Policies: Protect your cash flow. Stop absorbing 100% of the cost for customer indecision. Introduce a nominal return shipping fee (e.g., $5.99 deducted from the refund) or a restocking fee for non-defective items to filter out serial returners and recover reverse logistics overhead.
-
Optimize 3PL Return Inspection Workflows: Streamline warehouse triage. Work with your fulfillment partner to ensure returned items are inspected, graded, and restocked within 48 hours of arrival. Reducing inventory turnaround time keeps your working capital liquid and prevents stockouts on high-demand variants.
Frequently Asked Questions (FAQ)
What is an acceptable return rate for an e-commerce store?
An acceptable return rate varies heavily by industry. Consumer electronics and general home goods typically target under 5% to 8%. Apparel and footwear, however, naturally experience higher rates, often averaging 15% to 25%. If your apparel store exceeds 30%, your margins will face severe compression unless your initial product markup exceeds 4x.
Why do payment processors keep fees on refunded orders?
Payment gateways like Stripe, Shopify Payments, and PayPal incur interchange and network fees the moment an initial transaction is authorized and settled. Because payment networks do not refund these underlying interchange costs to the processor when a merchant issues a refund, processors pass that non-refundable loss directly to you.
How can I stop serial returners from bleeding my store?
Implement customer tagging and analytics to identify accounts with abnormal return frequencies (e.g., returning more than 50% of everything they buy). You can use Shopify apps to flag these customers, charge them return shipping fees, or restrict specific accounts from purchasing altogether if their return behavior causes a net loss.
From Financial Chaos to Verified Profit
Operating a direct-to-consumer brand while treating product returns as a minor bookkeeping footnote is a gamble that eventually destroys your bottom line. When your native e-commerce dashboard only celebrates gross sales and fails to subtract non-refundable gateway fees, reverse logistics handling costs, and inventory depreciation, you are flying blind. You cannot scale a brand safely when 25% of your orders are secretly leaking cash in transit.
This is exactly why elite Shopify merchants rely on Syncost.
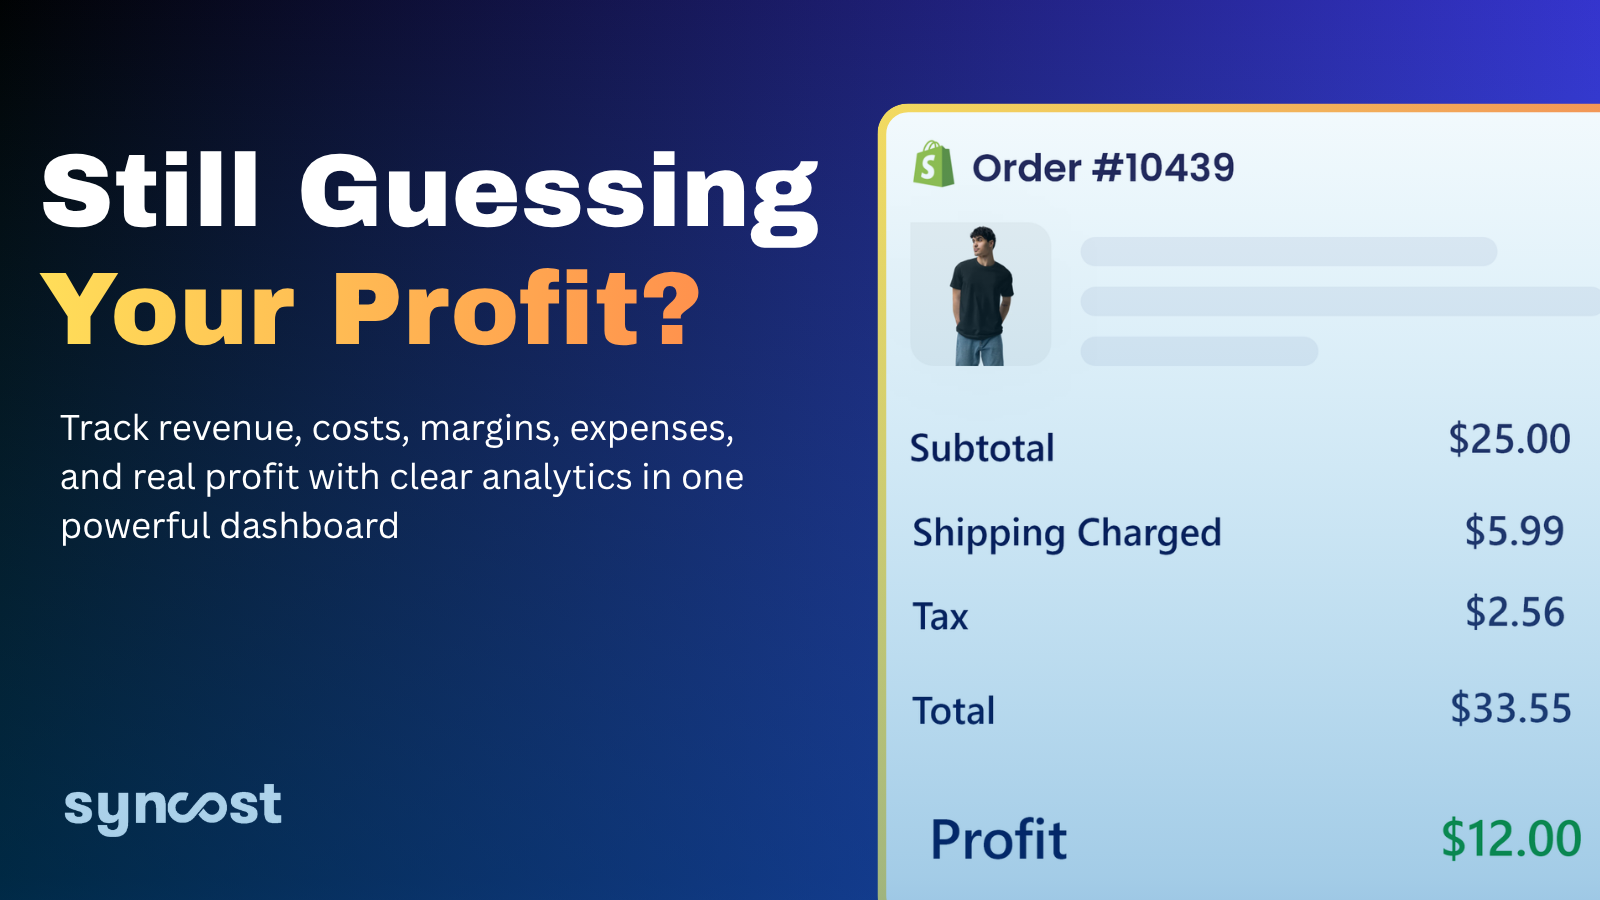
Syncost eliminates the illusions of top-line revenue reporting by integrating your Shopify store, payment gateways, ad platforms, and inventory logistics into a single, unified source of truth. It automatically tracks your refunds, non-refundable processing fees, and landed COGS in real-time, delivering your True Net Profit down to the exact penny.
Stop letting hidden return costs and reverse logistics friction drain your operating capital. Install Syncost today, lock down your return-adjusted unit economics, and scale your brand with the absolute, uncompromising precision of a veteran CFO.