The LTV Mirage: Why Your E-Commerce Subscription Strategy Is a Cash-Flow Time Bomb
Many e-commerce brands believe they are scaling safely because of a high Customer Lifetime Value (LTV) to Customer Acquisition Cost (CAC) ratio. In reality, they are calculating LTV on gross revenue while ignoring the compounding retention overhead, dunning failures, and software tier usage fees that quietly weaponize growth against liquidity.

The Hook & The Silent Problem: The Fatal Illusion of "Sticky" Revenue
Walk into any e-commerce masterclass or venture capital board meeting, and you will hear founders bragging about their recurring subscription revenue and an enviable 3x or 4x Customer Lifetime Value (LTV) to Customer Acquisition Cost (CAC) ratio. It sounds like the holy grail of digital commerce: pay a fixed amount upfront to acquire a buyer, and then sit back as automated billing cycles continuously inject predictable cash into your business.
However, this metric-driven complacency hides a catastrophic financial structural defect. The silent problem destroying scaling e-commerce subscription brands is Gross Margin Retention Decay.
Most operators calculate their LTV based purely on top-line gross revenue accumulated over a customer's lifecycle. They look at a subscriber who stays for six months at $50 per month and declare their LTV to be $300. This is a lethal administrative error. While your top-line revenue scales predictably, the invisible variable expenses required to sustain, fulfill, and bill those recurring orders scale exponentially.
As your subscriber base grows, you don't just ship more boxes; you trigger automated software usage tier jumps in your tech stack, accumulate compounding credit card processing fees, absorb multi-month credit card dunning failures, and subsidize continuous customer service human capital. If you are tracking a gross-revenue-based LTV against an upfront cash CAC, you are flying a plane with an instrument panel that is completely inverted. You think you are building a compounding asset, but you are actually scaling an operational cash-flow deficit.
Core Concept Explained (The Quick Answer): Defining True Net LTV
True Net Lifetime Value (Net LTV) is the total realized net profit a single customer generates over their entire relationship with your store after subtracting Cost of Goods Sold (COGS), Two-Way Logistics Costs, Gateway Transaction Fees, Retention Tech Stack Overhead, and Dunning Loss Allocations from every sequential order. True e-commerce scalability requires that your customer acquisition decisions be guided strictly by the net cash left in the bank after the final subscription cycle finishes, rather than the deceptive marketing revenue tracked on default pixel dashboards.
The Deep-Dive Reference Guide: The Hidden Variable Cost Ledger of Retention
To expose the financial leakages in a subscription or repeat-buyer model, you must evaluate the operational expenses attached to the tail end of the customer lifecycle. The initial purchase is easy to track; it is cycles two through twelve where the margin evaporates.
| Retention Expense Category | Impact on Net LTV | Operational Behavioral Profile |
|---|---|---|
| Recurring Gateway Processing Fees | Moderate | Flat percentage + fixed fee applied to every subsequent invoice automatically. |
| SaaS Usage Tier Creep (Email/SMS) | Extreme | Spikes violently as your active subscriber list crosses arbitrary database thresholds. |
| Dunning & Credit Card Decline Loss | High | Involuntary churn where inventory is shipped but payment fails to settle. |
| Subscription Platform Transaction Tax | Moderate | Hidden 1% to 1.5% fee levied by apps like Recharge or Loop on all recurring revenue. |
| Customer Support Overhead | High | Tickets regarding pauses, skips, address updates, and tracking numbers scale linearly with volume. |
| Sequential Fulfillment & Shipping | Extreme | Corroded by continuous fuel surcharges that happen long after the initial sale. |
Technical Breakdown & Formulas: The True Calculus of Customer Value
To eliminate the guess-work that routinely leads to hidden e-commerce insolvencies, you must abandon standard marketing platform formulas. You need to calculate profitability from a bottom-up balance sheet perspective.
First, identify the flawed formula that most Shopify store owners rely on:
Flawed Gross LTV = Average Order Value (AOV) * Average Number of Repeat Purchases
To find the actual cash velocity of your business, you must replace that calculation with the True Net LTV Formula. This tracks the net profit margin across the entire historical duration ($n$ representing the total number of billing cycles) of the customer relationship:
True Net LTV = Sum from i=1 to n of [(Gross Order Revenue_i - Discounts_i) - (COGS_i + Shipping_i + Gateway Fees_i + Platform App Fees_i + Allocated Support Costs_i)]
Once you have calculated your True Net LTV, you can determine your Realized Efficiency Capital Ratio (RECR) to know if your front-end marketing acquisition is actually sustainable:
Realized Efficiency Capital Ratio (RECR) = True Net LTV / Initial Front-End CAC
- Gross Order Revenue: The localized face value of the subscription invoice.
- Platform App Fees: The ongoing percentage cut taken by your recurring billing software engine.
- Allocated Support Costs: The total monthly cost of your customer service team and help-desk software divided by your total active subscriber volume.
- Initial Front-End CAC: The total blended marketing spend required to acquire that specific cohort of subscribers on day one.
The CFO's Rule of Solvency: If your RECR is below 1.5x, your business is functionally deteriorating. Because cash is spent upfront to acquire the customer via paid ads, but net margin is recovered over months, a low RECR means your cash-flow cycle is too slow to sustain inventory replenishment and general business overhead.
The Scaled Financial Impact (What It Actually Costs You): 100 vs. 5,000 Subscribers
Let us examine the reality of an e-commerce subscription box business retailing an organic supplement for $60.00 per month. The brand has a front-end CAC of $45.00. The average subscriber stays for a total duration of 5 months.
The Flawed Dashboard View:
- Gross AOV: $60.00
- Lifespan: 5 Months
- Reported Gross LTV: $300.00
- Gross LTV to CAC Ratio: 6.6x (Looks incredible on a venture pitch deck)
Now let's break down the real operational costs per billing cycle that the dashboard hides:
- Product Landed COGS: $15.00
- Pick, Pack, and Outbound Shipping: $8.50
- Shopify Payments + Subscription App Fee (2.9% + $0.30 + 1% app fee): $2.64
- Allocated Retention Marketing (Email/SMS flows per billing): $1.20
- Allocated Customer Support Ticket Friction: $2.00
- True Net Profit Per Cycle: $30.66
At 100 Subscribers (The Localized Test Phase):
- Total Gross Revenue: $30,000
- Total Front-End Capital Paid to Ads (100 * $45): $4,500
- Total Accumulated Net Profit Across 5 Months (100 * 5 * $30.66): $15,330
- True Net Financial Return (Net Profit - CAC): $10,830
At 5,000 Subscribers (The Danger Zone of Scale): As you scale to 5,000 active subscribers, operational complexity compounds. Your email/SMS platform pushes you into an enterprise database pricing tier (Klaviyo costs spike from $30/month to $1,800/month). Your churn rate increases, meaning customer support must expand to handling thousands of cancel/skip requests, driving allocated support costs per cycle up from $2.00 to $4.50. Furthermore, involuntary churn from expired or declined credit cards hits a standard 8% rate on cycles 3, 4, and 5—meaning you manufacture and ship product before realizing the invoice failed to clear.
Let's look at the adjusted scaled unit metrics:
- True Net Profit Per Cycle at Scale: $24.16 (Dropped due to tech bloat and labor overhead)
- Involuntary Dunning Settlement Losses: Over 5,000 subscribers, an 8% structural billing failure rate across cycles strips away an average of $3.50 per customer across their lifespan.
- Total Front-End Capital Paid to Ads (5,000 * $45): $225,000
- Total Accumulated Net Profit Across 5 Months (5,000 * 5 * $24.16): $604,000
- Minus Total Dunning Failure Cash Adjustments (5,000 * $3.50): -$17,500
- True Net Financial Return (Net Profit - CAC): $361,500
The Critical Margin Disconnect: By looking solely at the top-line dashboard, the merchant expected a gross cash return of $1,500,000 ($300 LTV * 5,000). Instead, the business realized an actual bankable return of $361,500. A massive $1,138,500 of phantom value disappeared into the mechanics of logistics, payment processing, app taxes, and dunning leakage.
If this brand spent capital or signed inventory production contracts based on their $1.5 million gross expectations, they would find themselves functionally bankrupt despite their Shopify dashboard showing massive growth.
Strategic Execution (How to Apply This to Your Business):
- Enforce Strict Dunning Automation Protocols: Never allow your subscription engine to ship a recurring order before receiving a positive authorization response from the gateway processor. Implement intelligent retries via automated dunning flows that systematically ping the customer's card at optimal times of the month (e.g., standard regional paydays) to minimize involuntary churn.
- Prune Inactive Profiles to Subvert SaaS Tier Spikes: Review your marketing automation platform monthly. If a subscriber cancels or pauses, immediately move them out of your high-velocity active messaging segments. Do not allow dead data profiles to sit in your database, inflating your monthly subscription software expenditures and eroding your retention margin.
- Tie Support Labor to Automation Portals: Minimize customer support cost expansion by integrating robust customer-managed customer portals. Let subscribers skip cycles, alter delivery dates, or adjust product variants independently without opening a high-cost customer service ticket. Every manual interaction handled by a human agent strips away your per-cycle net margin.
Frequently Asked Questions (FAQ)
Why does my Shopify dashboard show higher customer values than my accounting software?
Shopify tracks the raw transaction volume attributed to a customer identity without deducting operational costs. Your accounting software records actual bank payouts, which are processed net of gateway fees, app processing fees, returns, and ongoing operational SaaS expenses.
How do I factor credit card dunning failures into my LTV calculations?
Dunning failures should be categorized as an operational loss write-off. You must track the total value of products shipped for which payments were ultimately declined, and divide that total dollar loss across your entire active customer cohort to find the exact per-subscriber margin reduction.
Is it better to focus on increasing purchase frequency or reducing CAC?
Increasing purchase frequency via a net-profitable retention workflow is mathematically superior to chasing lower ad costs. Lowering front-end CAC is subject to external ad network algorithm volatility, whereas stabilizing your recurring net profit per cycle gives you the financial leverage to aggressively outspend your competitors on customer acquisition.
From Financial Chaos to Verified Profit
Scaling a subscription or recurring revenue brand without a bottom-up view of your margins is an invitation to financial ruin. Standard analytics platforms and spreadsheet models fail because they cannot track the intricate web of changing app costs, variable logistics fees, and asynchronous transaction data that occurs over a multi-month customer journey.
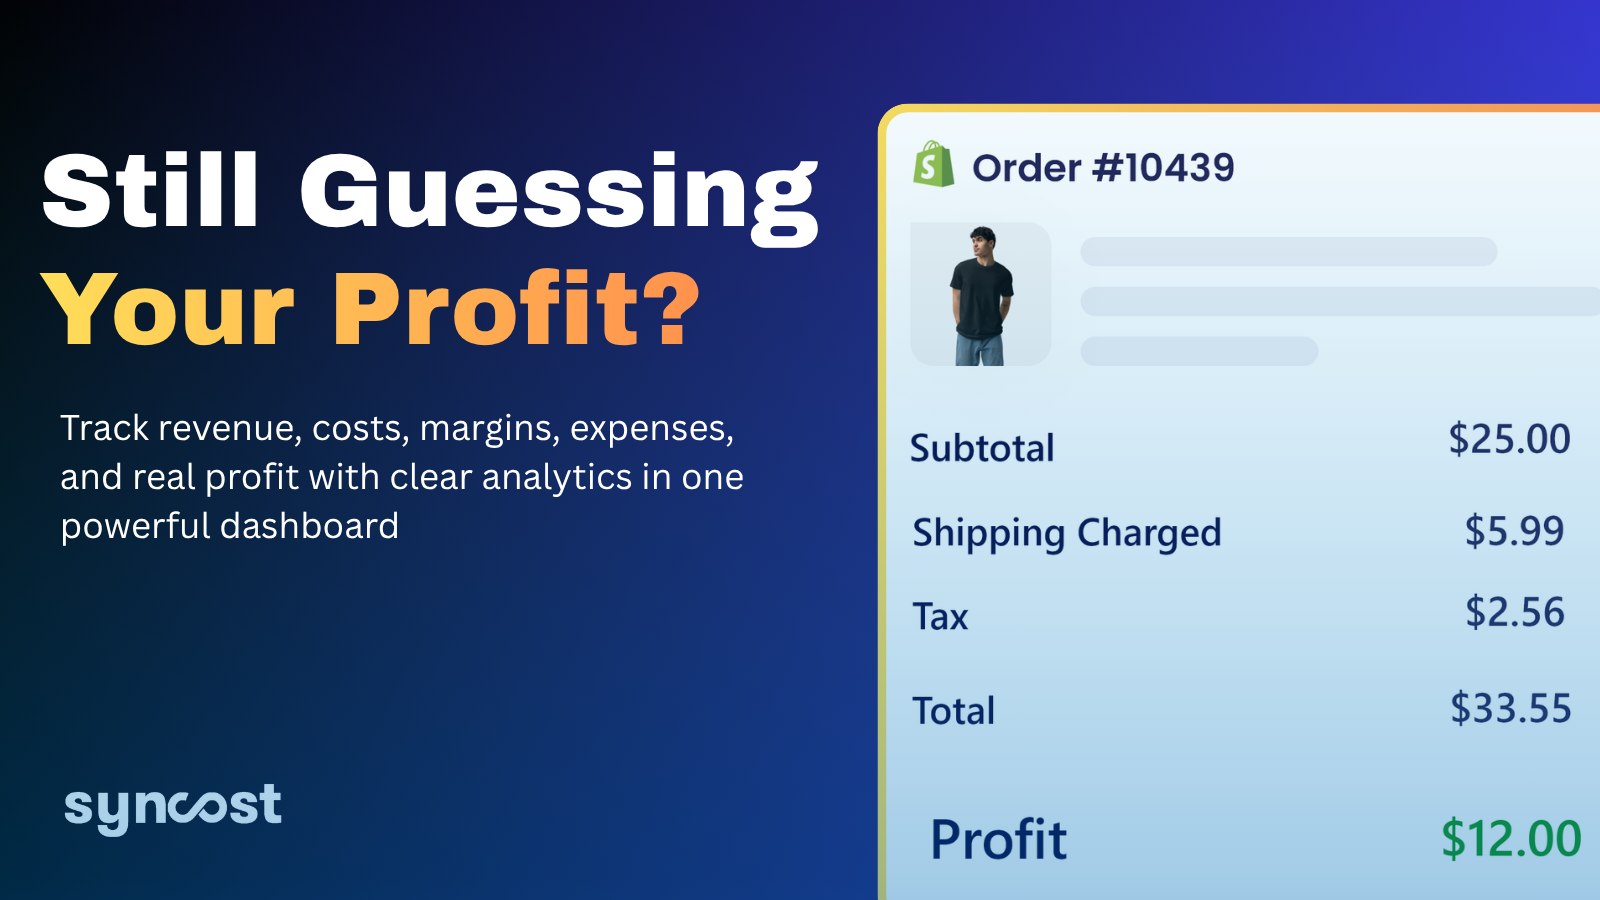
Syncost is engineered to solve this exact problem for scaling e-commerce brands. By directly integrating with your Shopify data streams, recurring billing systems, ad networks, and underlying tech stacks, Syncost eliminates the dangerous illusion of gross revenue metrics. It meticulously calculates your true, bottom-up Net LTV in real-time, subtracting every hidden variable cost automatically. Stop risking your cash flow on incomplete dashboard estimates. Let Syncost deliver the verified financial visibility you need to scale your store with absolute data-driven certainty.