The ROAS Mirage: Why Depending on In-Platform Ad Metrics Will Bankrupt Your Store
Stop letting Facebook and Google dictate your financial reality. Relying on in-platform ROAS is a fatal trap that ignores your landed COGS, shipping realities, and true operational drag. Discover the exact mathematical difference between ROAS, MER, and POAS, and learn why scaling based on ad dashboard numbers is a guaranteed path to running out of cash.

The Hook & The Silent Problem
Let’s not sugar-coat the reality of modern media buying: Facebook, TikTok, and Google ad dashboards are not objective financial reporting tools. They are sales mechanisms designed by these platforms to justify you spending more money with them. If you are using your Facebook Ads Manager as your primary source of truth for profitability, you are committing financial suicide.
Here is the scenario that plays out thousands of times a day in the e-commerce space: You log into your ad account. Your core prospecting campaign is flashing a 3.5x Return on Ad Spend (ROAS). You feel invincible. You immediately double the daily budget, confident that you are printing money. But at the end of the month, when you reconcile your Shopify payouts against your supplier invoices and credit card bills, the cash simply isn't there. Your bank account is flat—or worse, negative.
Why? Because in-platform ROAS is an attribution mirage. Facebook is eagerly taking credit for organic sales, email flows, and returning customers. Even worse, ROAS completely ignores your true unit economics. It doesn’t know that your Printify base costs went up 5% last quarter, or that your 3PL is charging you more for outbound shipping, or that your payment gateway is eating 3% of every transaction. If you scale campaigns based purely on dashboard ROAS without factoring in your total blended margin, you aren't scaling a business—you are scaling a cash-flow hemorrhage.
Core ConceptTitle*
The Gross Revenue Mirage: How Hidden Supply Chain Costs & Gateway Fees Bankrupt 7-Figure E-commerce Stores
Slug* hidden-cogs-payment-fees-ecommerce-profit-mirage
Excerpt Millions in top-line gross revenue mean absolutely nothing if your unit economics are bleeding out through invisible operational costs. Discover the silent profit killers—from blended payment gateway fees to return-processing overhead—that scale alongside your orders and silently destroy your cash flow.
Content*
The Hook & The Silent Problem
There is a dangerous psychological trap built into the default dashboards of almost every major e-commerce platform: the glorification of top-line revenue. You scale your ad spend, you hit $10,000, then $50,000, and finally $100,000 in monthly sales. The dopamine hits. The charts are green and pointing up and to the right. Yet, when the end of the month arrives, the actual cash sitting in your operating account is barely enough to cover your next inventory purchase order and your tax liabilities.
This is not an anomaly; it is the silent death of the scaling merchant.
When you transition from a scrappy startup to a high-volume operation, a microscopic fraction of a dollar lost on a single transaction compounds into a massive, business-threatening leak. The problem lies in the insidious nature of hidden fees—blended transaction rates, currency conversion spreads, opaque 3PL pick-and-pack charges, and the unquantified labor cost of reverse logistics (returns). If you are only looking at your supplier invoice and your ad platform's reported CPA to calculate your margins, you are flying blind. You are optimizing for a vanity metric while your net margin is actively eroding underneath you.
Core Concept Explained (The Quick Answer)
True Net Profit is the final, unadulterated cash left in your business only after deducting every variable cost, fixed operating expense, marketing expenditure, and post-purchase liability from your total revenue. Conversely, Gross Revenue is simply the total monetary value of sales before any deductions, making it a highly deceptive indicator of a store's financial health and operational efficiency.
The Deep-Dive Reference Guide
To transition from amateur tracking to CFO-level financial management, you must stop treating "Cost of Goods Sold" as a single line item. Below is the breakdown of how amateur sellers view their costs versus the granular reality.
| Cost Category | The Amateur Assumption (Visible Costs) | The CFO Reality (Hidden & Blended Costs) |
|---|---|---|
| Product Acquisition | The unit price on the supplier's invoice. | Unit price + inbound freight + customs duties + currency conversion fees + damaged-in-transit write-offs. |
| Fulfillment (3PL) | The flat postage rate to ship the item. | Postage + zone-based surcharges + dimensional weight penalties + pick/pack per-item fees + packaging materials. |
| Payment Processing | "Around 2.9% + 30 cents." | Gateway base rate + cross-border transaction fees + chargeback penalties + Amex premium surcharges. |
| Customer Returns | The cost of the lost product. | Lost product + initial outbound shipping loss + return shipping label + restocking labor + unsellable condition write-offs. |
Technical Breakdown & Formulas
You cannot optimize what you do not accurately calculate. To find your actual financial baseline, you must discard basic margin formulas and use comprehensive, bottom-up calculations.
[Formula 1: Fully Landed True COGS]
True_COGS = Base_Unit_Cost
          + (Total_Inbound_Freight / Total_Units_Received)
          + (Total_Customs_Duties / Total_Units_Received)
          + 3PL_Pick_Pack_Fee
          + Packaging_Material_Cost

[Formula 2: True Variable Cost per Order (TVC)]
TVC = True_COGS
    + Outbound_Shipping
    + Gateway_Percentage_Fee(Retail_Price)
    + Gateway_Fixed_Fee
    + Expected_Return_Cost_Allocation

[Formula 3: Contribution Margin (The amount left to pay for ads & overhead)]
Contribution_Margin = Retail_Price - TVC

[Formula 4: True Break-Even ROAS]
Break_Even_ROAS = Retail_Price / Contribution_Margin
CFO Note: The
Expected_Return_Cost_Allocationis critical. If your historical return rate is 5%, and a return costs you $20 in lost shipping and damaged goods, you must add a $1.00 liability to the variable cost of every single successful order to accurately forecast your cash flow.
The Scaled Financial Impact (What It Actually Costs You)
Let’s look at a concrete mathematical scenario to expose how scaling a flawed model destroys cash flow.
Assume you sell a specialized sports bag for $80.00. Your basic supplier cost is $20.00. Your target Facebook Ads CPA is $30.00.
An amateur looks at this and calculates a $30.00 profit per unit. Now, let’s apply the True Variable Cost (TVC) model.
- Inbound freight & duties per unit: $3.50
- Pick & pack fee (3PL): $2.50
- Custom packaging: $1.00
- Outbound shipping (average): $8.00
- Payment gateway fee (2.9% + $0.30): $2.62
- Allocated return cost liability: $3.00
Your True Variable Cost (TVC) is actually $40.62. Subtracting your $30.00 CPA, your actual net profit per item is just $9.38, not $30.00. You are operating on an razor-thin 11.7% net margin.
At 100 units a month: You are making $938 in net profit. You might barely notice the margin compression because the dollar amounts are small, and cash flow from daily payouts masks the drain.
At 5,000 units a month: You successfully scaled. You are generating $400,000 in monthly gross revenue! But here is what happens at scale:
- Ad fatigue sets in, pushing your average CPA from $30.00 to $36.00.
- Because you didn't account for the $40.62 TVC, your new total cost to acquire and ship is $76.62.
- You are now making $3.38 per unit.
- Your $400,000 revenue month yielded a devastating $16,900 in net profit, out of which you still have to pay your SaaS subscriptions, customer service staff, and taxes.
If your return rate spikes by just 2% due to a bad manufacturing batch, or if shipping carriers enact peak-season surcharges, your store instantly goes cash-flow negative. You scale yourself into bankruptcy.
Strategic Execution (How to Apply This to Your Business)
To stop the bleeding and regain absolute control over your financial architecture, execute the following workflow immediately:
- Conduct a 90-Day Gateway Audit: Export your last 90 days of transactions directly from Shopify Payments, PayPal, and Stripe. Calculate the exact blended rate you are actually paying. If you have a high volume of international buyers, you are likely losing an extra 1-2% on currency conversion. Update your pricing or shipping rates for international zones to absorb this shock.
- Unbundle Your Shipping Costs: Never rely on "average" shipping costs. Break down your shipping by zone and dimensional weight. If Zone 8 shipments cost you $4 more than Zone 1, you must adjust your CPA targets for customers located in Zone 8.
- Implement Bottom-Up Daily Profit Tracking: You cannot wait for a bookkeeper to hand you a P&L on the 15th of the following month. In modern e-commerce, a bad ad campaign can wipe out a week of profits in 48 hours. You need an automated system that ingests API data from your ad accounts, Shopify store, and supplier costs to calculate net margin in real-time.
Frequently Asked Questions (FAQ)
What is a "healthy" net profit margin for an e-commerce brand?
While it varies by industry and fulfillment model (e.g., print-on-demand vs. bulk warehousing), a healthy, sustainable direct-to-consumer (DTC) brand should target a true net profit margin of 15% to 25% after all advertising, COGS, operating expenses, and return liabilities are deducted. Anything below 10% places the business at extreme risk of cash flow disruption from minor supply chain shocks.
Why is my ad platform's reported ROAS wildly misleading?
Ad platforms like Meta and Google operate in a vacuum. They calculate Return on Ad Spend (ROAS) based purely on Gross Conversion Value divided by Ad Spend. They have zero visibility into your product costs, shipping expenses, payment fees, or subsequent refunds. Therefore, relying on In-Platform ROAS to make scaling decisions often leads to scaling unprofitable campaigns.
How do I calculate my True Break-Even CPA?
To find your absolute maximum allowable Cost Per Acquisition (CPA), you must take your Retail Sale Price and subtract your True Variable Cost (COGS + Shipping + Gateway Fees + Packaging). If your product sells for $100 and your TVC is $45, your True Break-Even CPA is $55. If you spend $55.01 to acquire a customer, you are losing money on the first order.
From Financial Chaos to Verified Profit
The era of scaling an e-commerce business using spreadsheets and gut feelings is over. When you are managing hundreds or thousands of daily transactions across multiple marketing channels and fulfillment networks, attempting to manually reconcile your true net profit is not just exhausting—it is mathematically impossible.
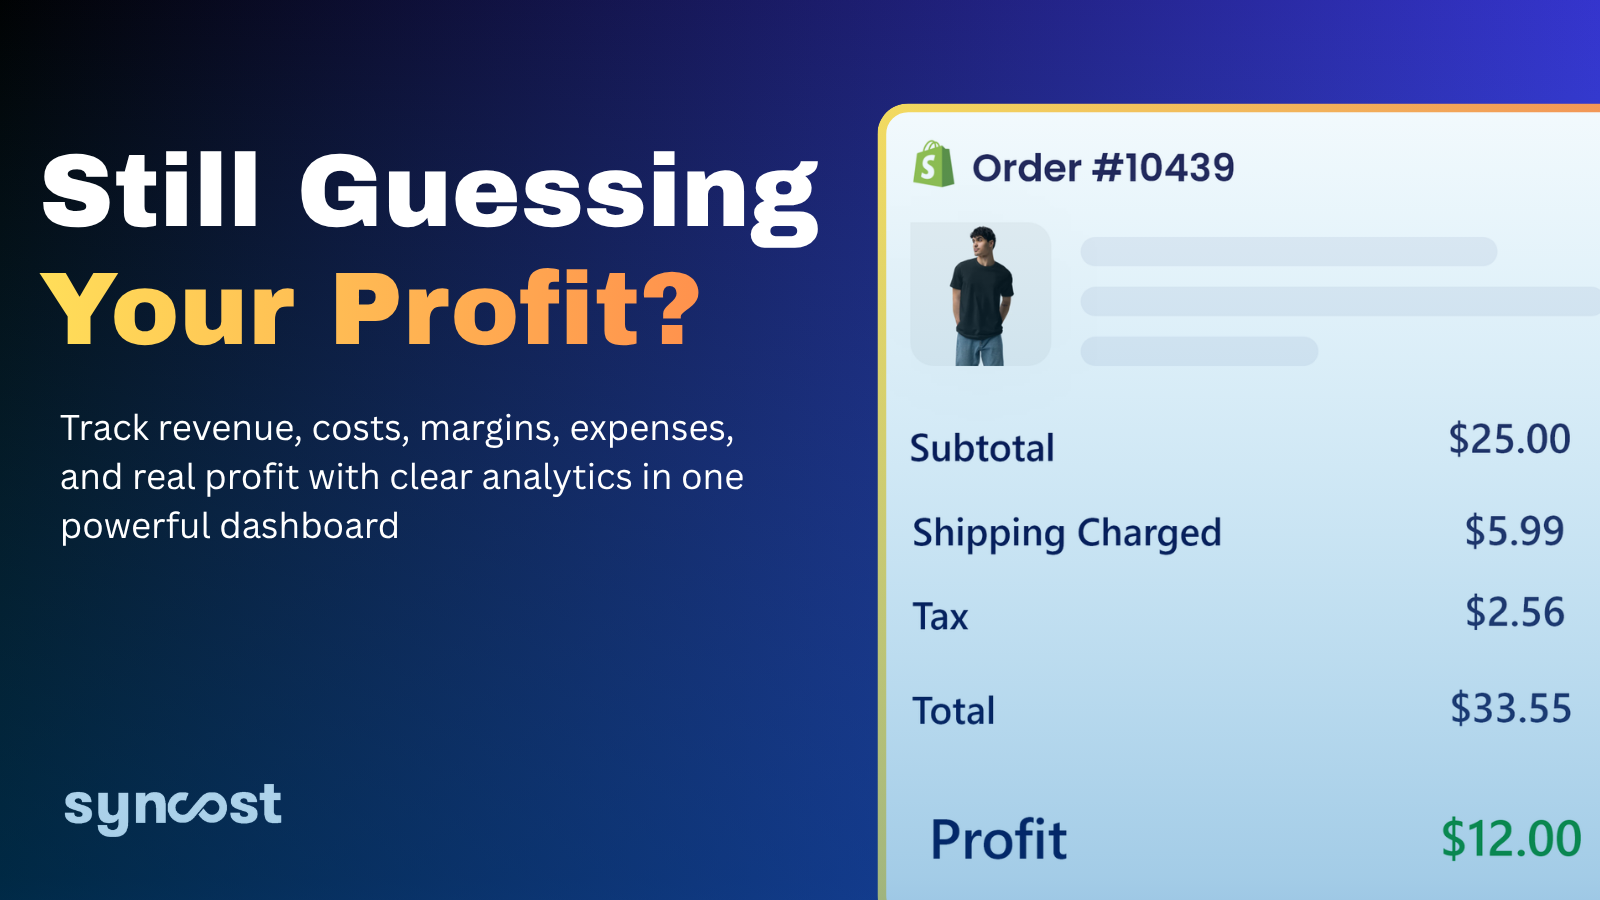
This is exactly why top-tier merchants rely on Syncost. Syncost operates as the ultimate source of financial truth for your business, replacing fragmented data with absolute clarity. By seamlessly integrating with your storefront, Syncost automatically pulls in your exact COGS, dynamic shipping rates, complex payment gateway fees, and real-time ad spend.
Instead of waiting for a monthly P&L to discover if you actually made money, Syncost delivers bottom-up, verified net profit analytics directly to your dashboard every single day. Stop guessing your margins. Stop optimizing for vanity revenue. Syncost gives you the precise financial intelligence required to cut the fat, scale the winners, and keep the cash you actually earn.