The ROAS vs. POAS Disconnect: Why Scaling Dropshipping Ads on Gross Revenue Will Liquidate Your Bank Account
Dropshipping communities are dangerously obsessed with Return on Ad Spend (ROAS). But when fluctuating agent sourcing costs, cross-border shipping rates, and payment gateway fees eat up 65% of your retail price, scaling based on gross revenue is a fast track to insolvency. If you aren't optimizing your media buying around true Profit on Ad Spend (POAS), you are blindly funding ad networks while bankrupting your own store.

The Hook & The Silent Problem: The Dashboard Vanity Flex
E-commerce Twitter and dropshipping Discord servers are flooded with the exact same screenshot: a Facebook Ads Manager dashboard showing a 3.2x ROAS and tens of thousands of dollars in daily revenue. To the untrained eye, this looks like a license to print money. The media buyer, euphoric over hitting their ROAS targets, aggressively scales the daily budget from $500 to $5,000. The Shopify dashboard lights up. The notifications pour in.
But thirty days later, the founder sits down to pay the month's bills. The sourcing agent in Shenzhen sends an invoice for $65,000. The credit card used for Facebook ads is maxed out at $40,000. Stripe is holding 15% of the revenue in a rolling reserve. When the founder looks at their actual bank account balance, there is almost nothing left. They generated six figures in revenue but are entirely illiquid.
This is the ROAS Death Spiral. ROAS is a fundamentally flawed, top-line vanity metric that only measures gross revenue against ad spend. It is entirely blind to your Cost of Goods Sold (COGS). In the dropshipping model, where your landed COGS (product cost + volumetric shipping + foreign exchange fees) are historically high and constantly fluctuating, a 3.0x ROAS might be wildly profitable for one product, but a catastrophic loss for another. If you are scaling campaigns based on platform ROAS instead of strictly monitoring your real-time net margins, you are orchestrating a massive, self-inflicted liquidity crisis.
Core Concept Explained (The Quick Answer): Escaping the Revenue Illusion
Return on Ad Spend (ROAS) calculates how much gross revenue you generate for every dollar spent on ads, completely ignoring the cost of the physical product. Profit on Ad Spend (POAS), however, calculates the actual gross margin (Revenue minus Landed COGS) generated for every dollar spent on ads. To survive dropshipping at scale, you must permanently abandon ROAS as your north star and force your media buyers to scale exclusively on a POAS above 1.0, ensuring every ad dollar deployed returns immediate, positive net cash.
The Deep-Dive Reference Guide: The Hierarchy of Ad Metrics
To stop bleeding cash on high-revenue campaigns, you must understand how ad platforms deceive you by withholding your operational expenses. The table below outlines the critical difference between the metrics you are watching and the metrics that actually dictate your financial survival:
| Metric | The Platform Definition | The Brutal Financial Reality |
|---|---|---|
| In-Platform ROAS | (Total Conversion Value / Ad Spend). A measure of top-line revenue efficiency. | Completely useless in dropshipping. Treats a $100 sale with a $10 COGS the exact same as a $100 sale with an $80 COGS. |
| Break-Even ROAS | The specific ROAS threshold required to exactly cover your product and shipping costs. | Fluctuates daily in dropshipping. If your agent raises shipping rates by $2, your Break-Even ROAS instantly rises, turning yesterday's "winning" ad into a loser. |
| Gross Margin | Revenue remaining after paying your supplier for the product and shipping. | This is the actual pool of money you have available to buy ads. If this number is low, your margin for error on Facebook or TikTok is virtually zero. |
| POAS (Profit on Ad Spend) | (Gross Margin / Ad Spend). Measures the efficiency of the cash you actually get to keep. | The ultimate truth. A POAS of 1.0 means you broke even. A POAS of 1.5 means you made 50 cents of pure profit for every dollar spent. |
| Contribution Margin | Net Cash remaining after COGS, Ads, and Gateway Fees. | The only metric that pays your software subscriptions, virtual assistants, and personal salary. |
Technical Breakdown & Formulas: The Math of Cash-Positive Scaling
Optimizing your media buying without knowing your exact break-even point down to the decimal is financial suicide. Your financial models must isolate the exact liquid cash available to acquire a customer.
First, calculate your True Dropship Gross Margin Percentage. This must include the hidden cross-border fees that most beginners ignore:
True Gross Margin % = ((Retail Price - Landed Product Cost - Volumetric Shipping - FX Transfer Fees - Gateway Fees) / Retail Price) * 100
Once you know your true margin, you can calculate the most important number in your business: Break-Even ROAS. If your ad campaigns drop below this number for even 48 hours, you are burning capital:
Break-Even ROAS = 1 / (True Gross Margin %)
(Example: If your Gross Margin is 40%, your Break-Even ROAS is 1 / 0.40 = 2.50. You must hit a 2.50 ROAS just to make zero dollars).
Finally, replace standard ROAS on your tracking dashboards with POAS (Profit on Ad Spend). This tells you if your scaling efforts are actually generating liquid wealth:
POAS = (Total Revenue - Total Landed COGS - Total Gateway Fees) / Total Ad Spend
The CFO's Reality Check: A 4.0 ROAS sounds elite, but if your dropshipping supplier charges you $75 for a product that you sell for $100, your Break-Even ROAS is actually 4.0. You could spend $100,000 on ads, generate $400,000 in revenue, and your net profit would be exactly $0.00. Revenue is vanity; POAS is sanity.
The Scaled Financial Impact (What It Actually Costs You): 100 vs. 5,000 Units
Let us map out a highly realistic financial simulation comparing two dropshipping products. Both products are running on Facebook Ads and generating the exact same 2.5x ROAS. We will see how scaling based on ROAS bankrupts the store.
Product A (The High-Margin Accessory):
- Retail Price: $40.00
- Total Landed COGS: $10.00 (75% Gross Margin)
- Break-Even ROAS: 1.33x
Product B (The Heavy Electronics Item):
- Retail Price: $100.00
- Total Landed COGS: $65.00 (35% Gross Margin)
- Break-Even ROAS: 2.85x
The Flawed Small-Scale Phase (At 100 Units of Product B): The media buyer tests Product B. They hit 100 sales at a 2.5x ROAS.
- Revenue: $10,000.00
- Ad Spend Required (at 2.5 ROAS): $4,000.00
- COGS Owed to Supplier: $6,500.00
- Actual Net Profit: ($10,000 - $6,500 COGS - $4,000 Ads) = -$500.00 Loss.
- The Illusion: The media buyer looks at the dashboard, sees $10,000 in revenue and a 2.5 ROAS, and assumes it's a winner because "2.5 is a good number." They blame the missing $500 on "testing costs" and decide to scale.
The Catastrophe Zone of Aggressive Scale (At 5,000 Units of Product B): Relying entirely on the ad platform's ROAS metric, the team aggressively scales the campaign over the next month to push 5,000 units.
- Gross Revenue: $500,000.00
- Total Cash Paid to Supplier (COGS): 5,000 * $65.00 = $325,000.00.
- Total Cash Paid to Ad Networks (at 2.5 ROAS): $200,000.00.
- Total Capital Deployed: $525,000.00.
- True Net Cash Retained: -$25,000.00 (Net Loss).
The Financial Devastation: By scaling a product with a Break-Even ROAS of 2.85 at a realized ROAS of 2.5, the founder just incinerated $25,000 of their own cash. If they had tracked POAS instead, they would have seen a POAS of 0.87 (meaning they were losing 13 cents on every dollar spent) on day one and killed the campaign immediately.
Strategic Execution: How to Systematically Mitigate the ROAS Trap
- Calculate and Distribute Break-Even ROAS at the SKU Level: You can no longer manage a store-wide "target ROAS." Every single product you dropship has a different weight, a different supplier cost, and therefore a different Break-Even ROAS. Create a ledger that clearly displays the Break-Even ROAS for every active SKU, and mandate that your media buyers reference it daily before adjusting budgets.
- Adjust for Dynamic Dropshipping Logistics: Dropshipping COGS are not static. In Q4, when airlines get congested, your private sourcing agent might increase the volumetric weight charge by $2.00. The moment that happens, your Gross Margin shrinks, and your Break-Even ROAS instantly rises. You must update your financial models in real-time the moment a supplier alters their pricing.
- Implement POAS as the Sole Metric for Scaling: Ban the use of ROAS as a key performance indicator in your team meetings. Force your marketing team to report exclusively on POAS and Contribution Margin. If a campaign is generating a massive ROAS but a negative POAS, it must be turned off immediately, regardless of how many sales it is driving.
Frequently Asked Questions (FAQ)
What is a good POAS for a dropshipping store?
Unlike ROAS, POAS is a universal metric. A POAS of exactly 1.0 means you broke even—your gross profit exactly covered your ad spend. A POAS below 1.0 means you lost money. A healthy, scalable dropshipping business should aim for a POAS of 1.25 to 1.5, meaning you are retaining 25 to 50 cents of net profit for every dollar you invest in paid media.
Why is my Facebook ROAS high, but I am still losing money?
Facebook does not know what you pay your Chinese supplier, nor does it know what Stripe charges you to process the payment. It only tracks the top-line retail price. If your landed product costs consume 60% of your retail price, your margin is incredibly thin. A high ROAS on Facebook simply means you are generating cheap revenue, but it doesn't mean you are generating enough margin to cover your backend operational costs.
How often do I need to recalculate my Break-Even ROAS?
In traditional e-commerce holding local inventory, you recalculate quarterly. In dropshipping, you must recalculate every time your sourcing agent changes their shipping matrix or your local currency experiences a severe fluctuation against the USD or RMB. Practically, this means you should be auditing your Break-Even ROAS weekly.
From Financial Chaos to Verified Profit
Managing a dropshipping business using ad platform dashboards and static Google Sheets is a guaranteed path to a liquidity crisis. When you are scaling multiple products with varying weights, volatile shipping costs, and tight margins, relying on "Blended ROAS" will silently hide the bleeding products that are destroying your net wealth.
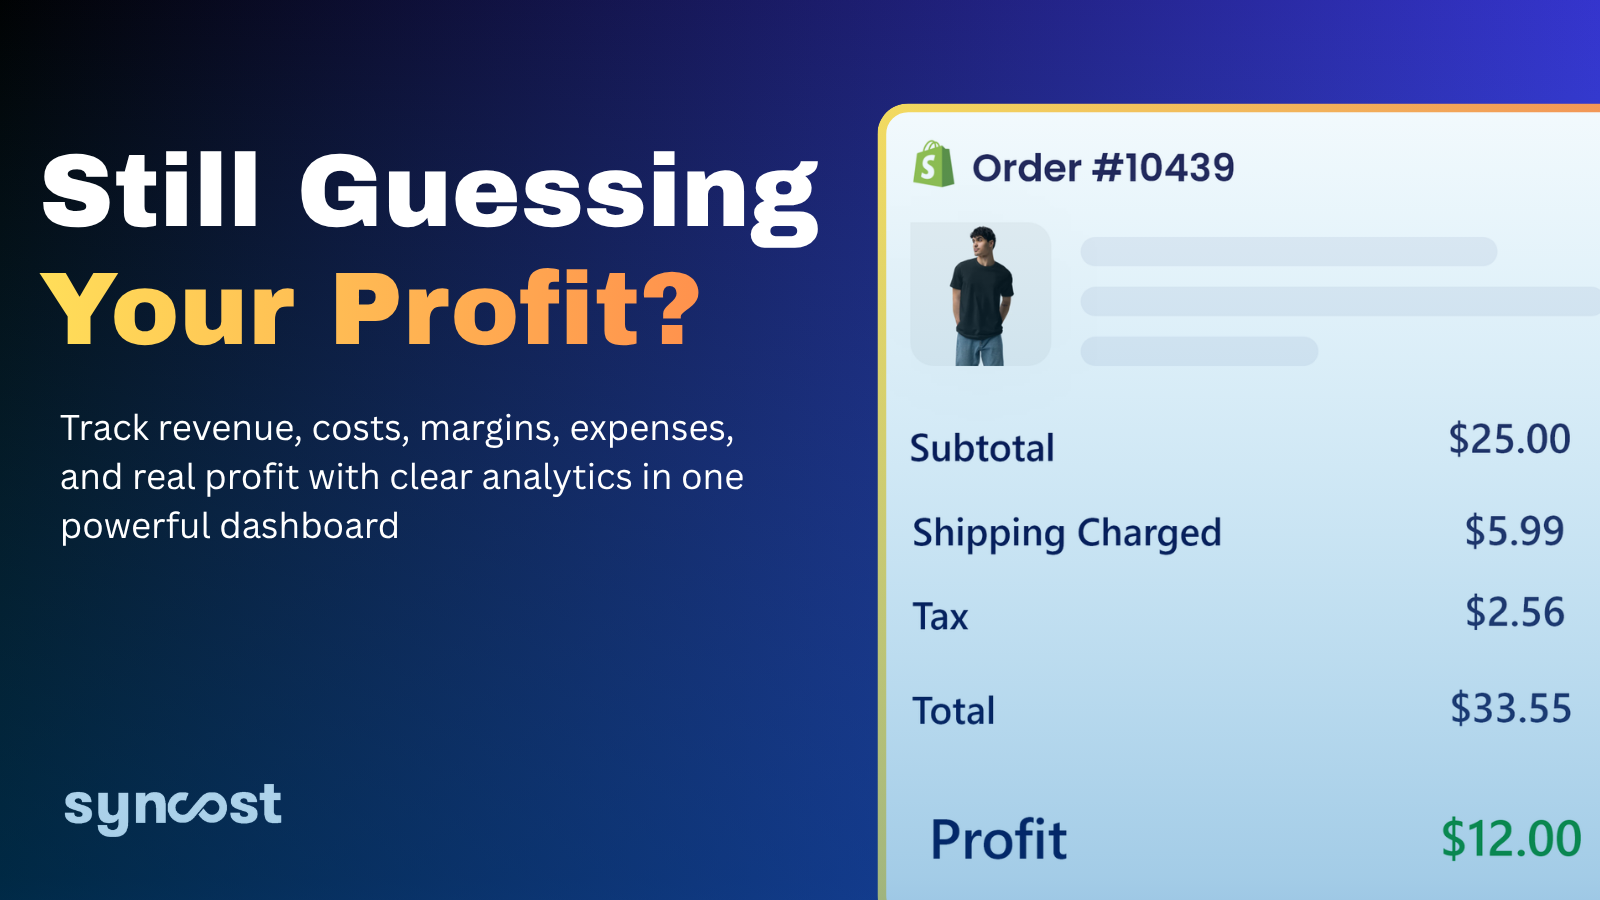
Syncost is engineered to obliterate the ROAS illusion. By pulling real-time, dynamic data directly from your Shopify store, your sourcing agent's COGS ledger, and your ad platforms, Syncost completely replaces top-line vanity metrics with bottom-up truth. It automatically calculates your exact POAS and Contribution Margin on a per-order and per-campaign level in real-time. You will never again have to guess if a high-revenue campaign is actually profitable. Stop scaling your ads into a cash-flow deficit. Let Syncost deliver the verified, granular financial clarity you need to scale your dropshipping empire safely.