Shopify Profit Margin by Product: How to Find the SKUs Actually Making You Money
Your best-selling Shopify product may not be your most profitable product. Learn how to calculate true profit margin by SKU, uncover products that look successful but quietly consume your cash, and identify the products worth scaling based on what they actually contribute to your business.

The Hook & The Silent Problem: Your Best Seller Might Be Your Worst Business Decision
Walk into almost any growing Shopify store and ask:
"What's your best-selling product?"
You will probably get an answer within seconds.
Ask:
"What's your most profitable product after COGS, shipping, transaction fees, advertising, refunds, and other variable costs?"
The answer usually takes much longer.
Sometimes nobody knows.
That is a problem.
Because the product that generates the most revenue is not necessarily the product that generates the most profit.
Imagine a store with three products.
Product A generates:
Revenue = $100,000
Gross Profit = $55,000
True Contribution = $12,000
Product B generates:
Revenue = $70,000
Gross Profit = $42,000
True Contribution = $20,000
Product C generates:
Revenue = $45,000
Gross Profit = $27,000
True Contribution = $18,000
Which product is the winner?
Revenue says:
Product A
Gross profit says:
Product A
But contribution says:
Product B
And contribution margin tells an even more interesting story.
Product A:
$12,000 ÷ $100,000
=
12%
Product B:
$20,000 ÷ $70,000
≈
28.57%
Product C:
$18,000 ÷ $45,000
=
40%
Now the picture changes completely.
Product A sells the most.
Product C produces the highest percentage margin.
Product B generates the largest absolute contribution.
Those are three different answers to three different questions.
Yet many Shopify stores make inventory, pricing, and advertising decisions using only the first question:
"What sells the most?"
That creates a dangerous incentive.
The merchant sees Product A generating $100,000 in revenue and decides:
"Let's put more money behind it."
But what if Product A requires expensive advertising?
What if shipping is unusually expensive?
What if it has a high refund rate?
What if its COGS is creeping upward?
What if its larger package size makes fulfillment expensive?
What if customers frequently buy it using deep discounts?
The product can become a revenue superstar and a profit underperformer at the same time.
This is one of the most important distinctions in ecommerce financial management:
Sales performance tells you how much demand a product captures. Profitability analysis tells you whether that demand is economically worth pursuing.
A product can win the sales ranking and lose the financial ranking.
And at scale, that difference can be enormous.
A $5 profit-margin mistake across 5,000 orders is:
5,000 × $5
=
$25,000
A $10 mistake becomes:
5,000 × $10
=
$50,000
That is why product-level profitability is not an optional analytics feature for a scaling ecommerce business.
It is a capital-allocation tool.
Core Concept Explained (The Quick Answer)
Shopify product profitability measures how much economic value each SKU generates after the costs required to sell and fulfill that product.
A simplified product contribution formula is:
Product Contribution
=
Net Product Revenue
- Product COGS
- Shipping / Fulfillment
- Transaction Fees
- Attributed Advertising
- Other Variable Costs
Product contribution margin is:
Product Contribution Margin %
=
Product Contribution
÷
Net Product Revenue
× 100
For more complete management reporting, businesses can also analyze operating expenses and calculate a fully loaded profit measure.
The key distinction is:
Revenue tells you which products sell. Product margin tells you which products deserve more of your money, inventory, attention, and advertising.
The Deep-Dive Reference Guide
| Metric | Formula | Example | What It Reveals |
|---|---|---|---|
| Gross Sales by SKU | Total sales attributed to product | $100,000 | Product demand |
| Discounts | Product-level promotional reductions | $8,000 | Price erosion |
| Refunds | Returned product revenue | $4,000 | Revenue leakage |
| Net Product Revenue | Sales after reductions | $88,000 | Actual revenue basis |
| Unit COGS | Product cost per unit | $22 | Sourcing economics |
| Total COGS | Unit COGS × units sold | $30,800 | Product cost burden |
| Shipping Cost | Fulfillment/delivery cost | $11,000 | Logistics burden |
| Transaction Fees | Fees attributable to sales | $3,000 | Payment burden |
| Advertising Cost | Acquisition spend attributed to product | $20,000 | Marketing burden |
| Other Variable Costs | Packaging, handling, etc. | $2,000 | Hidden variable costs |
| Gross Profit | Net Revenue - COGS | $57,200 | Product economics before selling costs |
| Contribution Profit | Revenue - all major variable costs | $28,200 | Actual sales contribution |
| Contribution Margin | Contribution ÷ Net Revenue | 32.0% | Product efficiency |
| Orders | Number of orders involving SKU | 1,500 | Demand volume |
| Units Sold | Units sold | 1,400 | Volume |
| Revenue Per Unit | Net Revenue ÷ units | $62.86 | Average realized price |
| Contribution Per Unit | Contribution ÷ units | $20.14 | Value created per unit |
| Return Rate | Returned units ÷ units sold | 8% | Product quality/economic risk |
| Profit Rank | SKU contribution compared with others | #2 | Capital allocation priority |
The most useful part of this framework is that it allows you to look at products from several angles.
Revenue Rank
Answers:
Which products generate the most sales?
Gross Profit Rank
Answers:
Which products have the strongest product-level economics before selling costs?
Contribution Rank
Answers:
Which products create the most economic value after major variable costs?
Margin Rank
Answers:
Which products retain the highest percentage of net revenue?
Profit Per Unit Rank
Answers:
Which product creates the most contribution each time we sell one unit?
These rankings can produce completely different winners.
That is normal.
The problem starts when a merchant assumes they should all point to the same SKU.
Technical Breakdown & Formulas
Formula 1: Net Revenue by Product
Start with:
Net Product Revenue
=
Gross Product Sales
- Product Discounts
- Product Refunds
- Other Relevant Revenue Reductions
Suppose Product A has:
Gross Sales = $100,000
Discounts = $7,000
Refunds = $5,000
Then:
Net Product Revenue
=
$100,000
- $7,000
- $5,000

= $88,000
The product did not economically generate $100,000 of retained sales.
Its realized product revenue was $88,000 under this simplified model.
That distinction alone changes the margin calculation.
Formula 2: Total Product COGS
Suppose Product A has:
1,400 units sold
$22 unit COGS
Then:
Total COGS
=
1,400 × $22

= $30,800
Gross profit:
$88,000 - $30,800
=
$57,200
Gross margin:
$57,200 ÷ $88,000 × 100

=
65%
A 65% gross margin looks very strong.
But we are only halfway through the financial story.
Formula 3: Product Contribution
Now subtract other variable costs.
Assume:
Shipping = $11,000
Transaction Fees = $3,000
Advertising = $20,000
Other Variable Costs = $2,000
Then:
Contribution Profit
=
$88,000
- $30,800
- $11,000
- $3,000
- $20,000
- $2,000

=
$21,200
Contribution margin:
$21,200 ÷ $88,000 × 100

≈
24.09%
The product went from:
65% Gross Margin
to:
24.09% Contribution Margin
Nothing about the sales number changed.
The product still generated $88,000 of net revenue.
The difference is what happened when the full variable cost stack was considered.
That is exactly why product-level gross margin alone is insufficient for many ecommerce decisions.
Formula 4: Profit Per Unit
Using the same example:
Contribution Profit = $21,200
Units Sold = 1,400
Therefore:
Contribution Per Unit
=
$21,200 ÷ 1,400

≈
$15.14
Now you have a highly actionable number.
Each additional unit contributes approximately:
$15.14
under the simplified assumptions.
That can be compared directly against other products.
Formula 5: Product Contribution Margin
Use:
Contribution Margin %
=
Contribution Profit
÷
Net Product Revenue
× 100
For Product A:
$21,200 ÷ $88,000 × 100
≈
24.09%
Now imagine Product B:
Net Revenue = $70,000
Contribution = $20,000
Contribution margin:
$20,000 ÷ $70,000 × 100

≈
28.57%
Product B generates less total contribution:
$20,000 vs $21,200
but higher contribution efficiency:
28.57% vs 24.09%
That creates a strategic choice.
If inventory is constrained, which product should receive priority?
There is no universal answer.
You need to consider:
Contribution Per Unit
Contribution Margin
Sales Velocity
Inventory Turnover
Customer Acquisition Cost
Repeat Purchase Potential
Capacity Constraints
That is a financial decision.
Not a sales-ranking decision.
Formula 6: Break-Even Product Margin
Suppose your product creates:
$70 Net Revenue
$40 Variable Cost Before Advertising
Then:
Contribution Before Ads
=
$30
If customer acquisition costs:
$32
then:
Contribution After Ads
=
$30 - $32
=
-$2
The product is generating negative contribution after acquisition.
This matters because a product can have a high gross margin and still be impossible to scale profitably with paid acquisition at its current price and cost structure.
The Scaled Financial Impact (What It Actually Costs You)
Let's compare three products in the same Shopify store.
Product A — The Best Seller
Net Revenue Per Order = $100
COGS = $32
Shipping = $10
Fees = $4
Advertising = $30
Other Variable Costs = $4
Contribution:
$100
- $32
- $10
- $4
- $30
- $4

=
$20
Contribution margin:
20%
Now suppose the store sells:
5,000 orders
Contribution:
5,000 × $20
=
$100,000
This is a major seller.
Product B — The Quiet Money Maker
Net Revenue Per Order = $80
COGS = $24
Shipping = $7
Fees = $3
Advertising = $15
Other Variable Costs = $2
Contribution:
$80
- $24
- $7
- $3
- $15
- $2

=
$29
Contribution margin:
$29 ÷ $80
=
36.25%
Suppose it generates:
3,000 orders
Total contribution:
3,000 × $29
=
$87,000
Product B generates less contribution than Product A:
$87,000 vs $100,000
But it requires:
2,000 fewer orders
and retains a much larger percentage of revenue.
Product C — The Premium Product
Net Revenue Per Order = $140
COGS = $45
Shipping = $10
Fees = $5
Advertising = $20
Other Variable Costs = $3
Contribution:
$140
- $45
- $10
- $5
- $20
- $3

=
$57
Contribution margin:
$57 ÷ $140
≈
40.71%
Suppose it only sells:
1,000 orders
Contribution:
1,000 × $57
=
$57,000
Now look at the three:
| Product | Orders | Revenue | Contribution | Contribution Margin |
|---|---|---|---|---|
| A | 5,000 | $500,000 | $100,000 | 20.00% |
| B | 3,000 | $240,000 | $87,000 | 36.25% |
| C | 1,000 | $140,000 | $57,000 | 40.71% |
Product A dominates revenue.
Product A also generates the most absolute contribution.
But Product C produces more than twice the contribution per order.
Product A = $20/order
Product B = $29/order
Product C = $57/order
That changes how you should think about growth.
Suppose the store can only fulfill an additional 1,000 orders next month.
If those 1,000 orders go to Product A:
1,000 × $20
=
$20,000 additional contribution
If they go to Product C:
1,000 × $57
=
$57,000 additional contribution
The same capacity produced:
$57,000 - $20,000
=
$37,000
more contribution.
That is a $37,000 capital-allocation difference created by choosing the more profitable product.
And this is why "best-selling product" is such an incomplete metric.
Now Introduce a COGS Increase
Suppose Product A's supplier raises COGS from:
$32 → $37
Contribution becomes:
$100
- $37
- $10
- $4
- $30
- $4

=
$15
The contribution per order falls by:
$20 - $15
=
$5
At 5,000 orders:
5,000 × $5
=
$25,000
The supplier's $5 cost increase has reduced contribution by:
$25,000.
Product A still sells 5,000 orders.
Revenue is still:
$500,000
But its economic value has deteriorated.
This is exactly why SKU-level profitability must be monitored continuously.
Now Introduce a Shipping Increase
Product B's shipping rises from:
$7 → $12
New contribution:
$80
- $24
- $12
- $3
- $15
- $2

=
$24
Previous contribution:
$29
Decrease:
$5/order
At 3,000 orders:
3,000 × $5
=
$15,000
The product just lost:
$15,000 of contribution
without changing its selling price.
Now Introduce a CAC Increase
Product C's advertising cost increases:
$20 → $30
Contribution becomes:
$140
- $45
- $10
- $5
- $30
- $3

=
$47
Previous contribution:
$57
Decrease:
$10/order
At 1,000 orders:
1,000 × $10
=
$10,000
The product remains highly profitable.
But the economic attractiveness has changed.
This matters for advertising allocation.
The merchant should not ask only:
"Does Product C have good margins?"
The question is:
"Are the current acquisition economics still strong enough to justify additional spend?"
Strategic Execution (How to Apply This to Your Business)
Step 1: Build a SKU-Level Profit Table
Every meaningful product should have its own profitability record.
At minimum:
SKU
Units Sold
Net Revenue
COGS
Shipping
Transaction Fees
Advertising
Other Variable Costs
Contribution
Contribution Margin
Contribution Per Unit
Do not rely on store averages.
A store-wide average can hide a disastrous SKU.
Step 2: Separate Revenue Winners From Profit Winners
Create separate rankings:
Top Revenue Products
Top Gross Profit Products
Top Contribution Products
Top Margin Products
Top Profit-Per-Unit Products
Now you can see where the winners overlap.
If the same SKU dominates every list, excellent.
If different SKUs dominate different lists, that is where financial analysis becomes valuable.
Step 3: Calculate Contribution Per Unit
This is especially important when inventory or fulfillment capacity is constrained.
Example:
Product A = $15 contribution/unit
Product B = $28 contribution/unit
Product C = $45 contribution/unit
If you can only produce 1,000 additional units:
A → $15,000 contribution
B → $28,000 contribution
C → $45,000 contribution
Under the simplified assumptions, Product C creates $30,000 more contribution than Product A using the same number of units.
That is why contribution per unit is often more useful for capacity allocation than revenue per unit.
Step 4: Analyze Margin Before and After Advertising
Create two numbers:
Contribution Before Ads
Contribution After Ads
This tells you whether the product itself is economically strong or whether it only looks good because acquisition costs have been excluded.
For example:
Product A

Before Ads = $50
After Ads  = $17
The product may have excellent gross economics but expensive customer acquisition.
Another product:
Product B

Before Ads = $38
After Ads  = $26
Product B may be the better paid-acquisition candidate.
Step 5: Measure Product-Specific CAC
Do not automatically apply store-wide CAC to every product.
Suppose:
Store CAC = $20
But:
Product A CAC = $28
Product B CAC = $15
Those products have completely different acquisition economics.
Use product-specific data where attribution permits.
Step 6: Track Product Refund and Return Rates
Two products can have identical sales and COGS but radically different final economics.
Product A:
Return Rate = 3%
Product B:
Return Rate = 14%
Product B may have:
- higher return shipping,
- more customer-service cost,
- more processing effort,
- more inventory handling,
- reduced resale value,
- higher refund exposure.
Therefore, product profitability should not be considered complete if meaningful return-related costs are being ignored.
Step 7: Analyze Profit by Variant
A parent product can hide substantial variation.
Example:
| Variant | Revenue | COGS | Contribution | Margin |
|---|---|---|---|---|
| Small | $20,000 | $7,000 | $6,000 | 30% |
| Medium | $30,000 | $10,000 | $10,000 | 33.3% |
| Large | $25,000 | $11,000 | $6,000 | 24% |
| XL | $15,000 | $8,000 | $2,000 | 13.3% |
If the merchant evaluates only the parent product:
Total Revenue = $90,000
Total Contribution = $24,000
the XL problem may remain invisible.
Variant-level profitability shows where margin is actually being destroyed.
Step 8: Analyze Product Profit by Channel
A product can be profitable through one acquisition source and weak through another.
For example:
Product A + Google
Contribution = $30/order

Product A + Meta
Contribution = $14/order
It is still the same product.
The economic result changes because acquisition efficiency changes.
This is why product-level profitability and channel-level attribution should eventually meet.
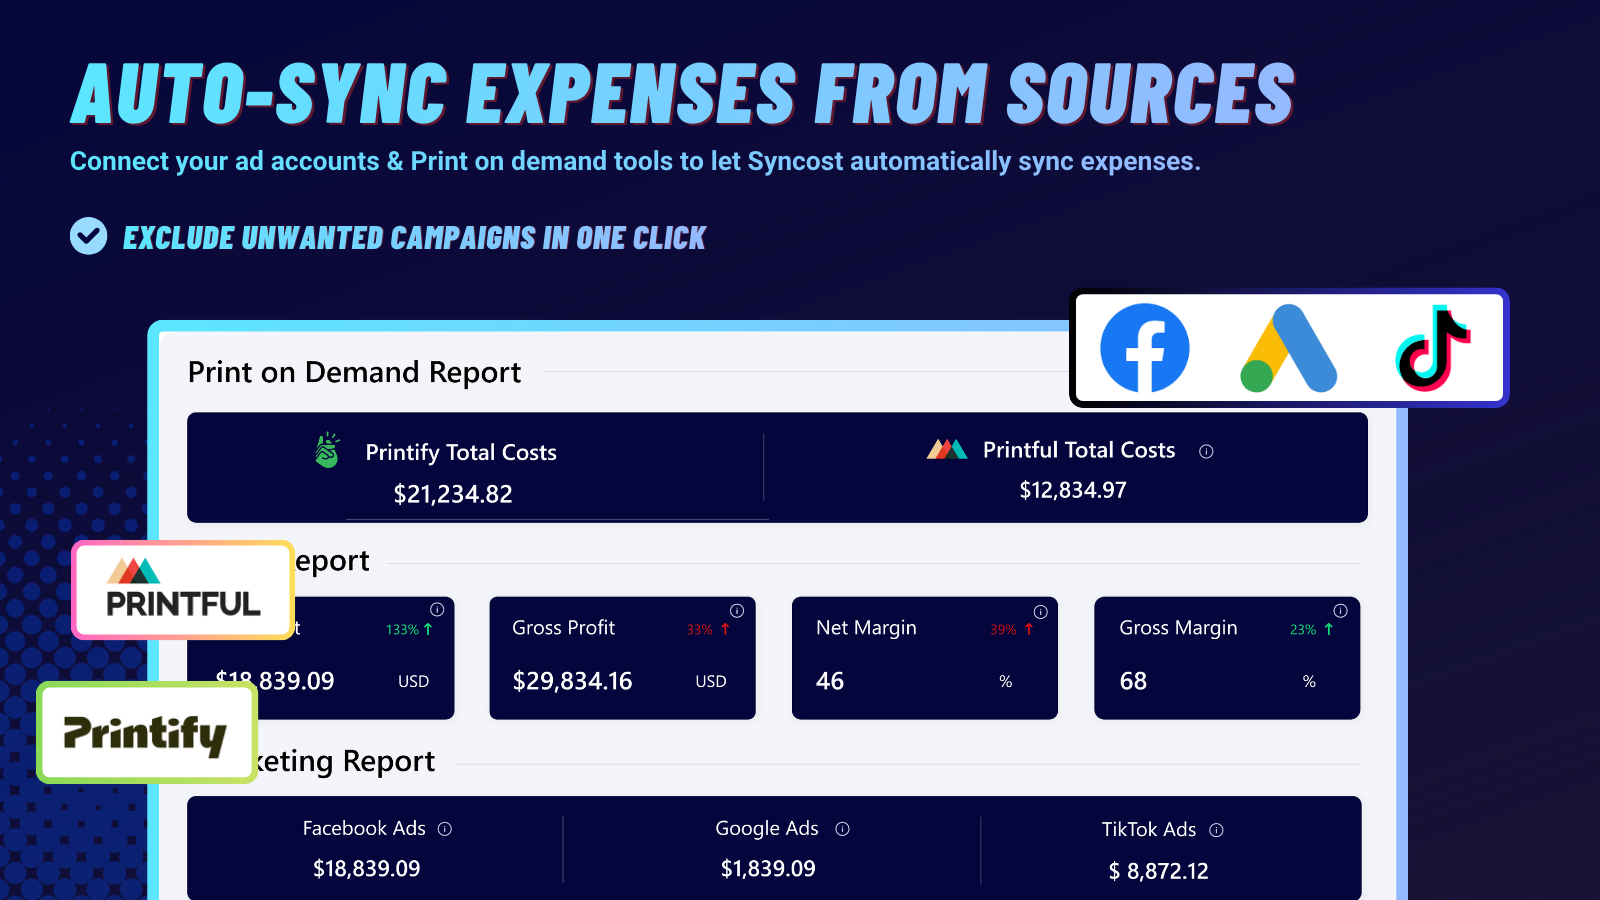
Syncost's current Shopify App Store listing includes profit insights, product-level net profit, ROAS by channel, marketing attribution, and integrations with Facebook Ads, Google Ads, TikTok Ads, Printful, and Printify.
Step 9: Track Product Margin Over Time
Do not compare only this month versus last month.
Look for trends:
January = 38%
February = 35%
March = 32%
April = 27%
A product can remain the best seller while its margin gradually collapses.
That is particularly dangerous because revenue growth can hide the deterioration.
The correct question is:
"Is this SKU becoming more or less economically attractive over time?"
Step 10: Find Margin Compression Early
Margin compression can come from:
Supplier Price Increase
Shipping Increase
Advertising Inflation
Higher Refund Rate
More Discounts
Higher Transaction Costs
Fulfillment Changes
Currency Effects
You need to identify which variable moved.
For example:
Revenue = Stable
COGS = +$3
Shipping = +$2
CAC = +$4

Total Contribution Decline
=
$3 + $2 + $4
=
$9/order
At 2,500 orders:
2,500 × $9
=
$22,500
A product can therefore lose $22,500 of contribution without experiencing any decline in sales.
That is the definition of a profitability problem hidden behind stable revenue.
Step 11: Automate Product Profitability
This is where the workflow naturally moves beyond spreadsheets.
A product-level profitability calculation requires several synchronized inputs:
Shopify Sales
+
Product / Variant
+
COGS
+
Shipping
+
Fees
+
Advertising
+
Refunds
+
Custom Costs
Syncost's current Shopify App Store listing explicitly provides net profit by product, SKU margin calculation, COGS management, shipping-cost profiles, advertising synchronization, recurring/custom cost tracking, historical analysis, and order-level profit alerts.
That is important because product profitability is only useful when the underlying product costs remain current.
A dashboard that tells you:
"Product A has a 35% margin"
is only as useful as the COGS and other costs behind that 35%.
If the supplier raised COGS six weeks ago and the system still uses the old cost, the report is precise—but wrong.
Step 12: Use Syncost to Move From SKU Rankings to Actual Decisions
This is where Syncost becomes more than another analytics screen.
The current Shopify App Store listing says Syncost can show true profit by order, product and day, sync advertising spend from Meta, TikTok and Google, pull COGS from Printify and Printful, include Shopify fees and shipping, track recurring costs, and calculate margins per SKU.
That gives the merchant a much more useful workflow:
SKU
 ↓
Revenue
 ↓
COGS
 ↓
Shipping
 ↓
Fees
 ↓
Advertising
 ↓
Contribution
 ↓
Margin %
 ↓
Profit Rank
 ↓
Business Decision
Now the product table stops being a reporting artifact.
It becomes a decision tool.
You can use it to determine:
- which SKUs deserve more ad spend,
- which products need price increases,
- which products need supplier renegotiation,
- which variants should be discontinued,
- which products deserve more inventory,
- which products should be bundled,
- which products should receive promotions,
- which products should be protected from discounting.
Step 13: Create Product Decision Bands
A practical approach is to place SKUs into categories:
A — Scale
High Contribution + Healthy Margin

B — Optimize
Good Revenue + Margin Problem

C — Fix
Strong Demand + Weak Economics

D — Watch
Low Volume + Strong Margin

E — Remove / Reposition
Low Demand + Weak Economics
This is much more useful than a simple "Top Products" list.
A product with:
$500,000 Revenue
8% Contribution Margin
should not automatically receive more investment than a product with:
$180,000 Revenue
32% Contribution Margin
The correct decision depends on the broader economics and strategic role of each product.
But at least now you are asking the right question.
Frequently Asked Questions (FAQ)
How do I calculate profit margin by product on Shopify?
Start by calculating the net revenue generated by the SKU, then subtract the costs attributable to that product.
A simplified formula is:
Product Contribution
=
Net Product Revenue
- COGS
- Shipping
- Transaction Fees
- Advertising
- Other Variable Costs
Then:
Product Contribution Margin %
=
Product Contribution
÷
Net Product Revenue
× 100
For example:
Net Revenue = $100
COGS = $30
Shipping = $8
Fees = $3
Advertising = $20

Contribution
=
$100 - $30 - $8 - $3 - $20
=
$39
Contribution margin:
$39 ÷ $100
=
39%
The exact calculation should reflect your defined accounting and management methodology.
Should I rank Shopify products by revenue or profit?
Use both, but do not confuse them.
Revenue tells you which products have demand.
Profit tells you which products create economic value.
A strong product analysis should compare:
Revenue
Gross Profit
Contribution
Contribution Margin
Profit Per Unit
Units Sold
Refund Rate
CAC
A high-revenue product may have weak contribution because of high COGS, shipping, discounts, returns, or advertising costs.
Why is my best-selling Shopify product not my most profitable?
Because sales volume does not determine profitability.
A best-selling product might have:
High COGS
High Shipping
High CAC
Large Discounts
High Refund Rate
while a lower-volume product might have:
Low COGS
Low Shipping
Lower CAC
Strong Pricing
Low Refund Rate
The second product can generate significantly more contribution per order.
That is why SKU-level profitability should be analyzed separately from sales rankings.
How do I calculate SKU profitability after advertising?
Start with product-level net revenue and subtract product and selling costs:
SKU Profit After Ads
=
Net SKU Revenue
- COGS
- Shipping
- Transaction Fees
- Attributed Ad Spend
- Other Variable Costs
The critical issue is attribution.
Advertising platforms use different attribution methodologies, so comparisons should use a consistent methodology.
The purpose is not to create mathematically perfect attribution.
It is to produce a consistent economic framework for making better allocation decisions.
How can I see which Shopify products are actually profitable?
You need product-level profitability data rather than only sales data.
The required inputs generally include:
Product Revenue
Product COGS
Shipping
Transaction Fees
Advertising
Refunds
Other Costs
Syncost's current Shopify App Store listing provides net profit by product, SKU margin calculation, COGS management, advertising synchronization, shipping cost profiles, custom cost categories, and order-level profit alerts.
That allows the merchant to move from:
"Product A sold the most."
to:
"Product A generated this much net contribution after the costs required to sell it."
That second statement is much more useful for financial decisions.
From Financial Chaos to Verified Profit
A Shopify store does not have a single "best product."
It has products that win at different dimensions.
One may win revenue.
Another may win contribution.
Another may win margin percentage.
Another may win profit per unit.
Another may generate the strongest repeat-purchase behavior.
Another may require very little advertising.
Another may be exceptionally valuable as an acquisition product.
The mistake is trying to compress all of those dimensions into one sales leaderboard.
A better model is:
PRODUCT
   ↓
Revenue
   ↓
Gross Profit
   ↓
Contribution
   ↓
Contribution Margin
   ↓
Profit Per Unit
   ↓
CAC
   ↓
Refund / Return Economics
   ↓
Customer Value
   ↓
Capital Allocation
That is how a financially mature Shopify store thinks about products.
Not:
"This one sells the most."
But:
"This one creates the most valuable economic outcome for the resources we put into it."
The difference sounds subtle.
It is not.
Consider the earlier example.
Product A:
5,000 orders
$20 contribution/order
=
$100,000 contribution
Product C:
1,000 orders
$57 contribution/order
=
$57,000 contribution
Product A creates more total contribution.
So why would Product C matter?
Because the merchant may have limited:
Inventory
Cash
Fulfillment Capacity
Advertising Budget
Production Capacity
Warehouse Space
If only 1,000 additional orders can be created next month, the economics of each incremental order matter enormously.
This is why contribution per unit and contribution per order are capital-allocation metrics.
They tell you what happens when you put another dollar, unit, ad impression, warehouse slot, or production hour behind the product.
And this is where automated product-level profitability becomes more valuable as a store grows.
Syncost currently positions its Shopify product around exactly this problem: it provides net profit by product, order, and day; SKU margin calculation; COGS management; shipping cost profiles; advertising integrations; custom costs; and P&L reporting.
It also supports COGS synchronization from Printify and Printful, which is particularly relevant for merchants whose SKU economics depend on print-on-demand fulfillment costs rather than manually maintained product-cost spreadsheets.
That means the workflow can move from:
Shopify Product Report
        ↓
Export CSV
        ↓
COGS Spreadsheet
        ↓
Shipping Spreadsheet
        ↓
Advertising Export
        ↓
Manual Matching
        ↓
Formula Problems
        ↓
Final Product Margin
to:
Shopify
 +
COGS
 +
Shipping
 +
Fees
 +
Advertising
 +
Custom Costs
 ↓
Product Profitability
 ↓
Margin Ranking
 ↓
SKU Decision
The second model does not eliminate the need for financial judgment.
It makes the judgment possible.
Because the hardest product question is rarely:
"How much did we sell?"
The difficult question is:
"Was selling this product economically worth the resources we consumed to make it happen?"
A product with $1 million in revenue can be a weak business asset.
A product with $200,000 in revenue can be a phenomenal one.
It depends on what remains after the costs.
And that is the principle every Shopify merchant should remember:
Do not scale products because they sell. Scale products because the economics of selling them are attractive.
Revenue creates attention.
Margin creates options.
Contribution creates operating power.
And verified product-level profit tells you where that power is actually coming from.