How to Run a Profitable Print-on-Demand T-Shirt Business (The Numbers That Matter)
Most POD t-shirt guides tell you to pick a niche and upload designs. This one shows you the math behind whether the business actually works — blank cost, print cost, platform fees, ad spend, and the exact CAC break-even that decides if each shirt sold moves you forward or quietly backward.

Most print-on-demand t-shirt content follows the same script: pick a niche, upload designs, connect your store, watch the sales roll in. What that script skips is the part that decides whether you actually make money — the unit economics. The numbers that show whether each shirt sold moves you forward or quietly backward.
This guide is the one that shows whether the business works. Not in theory, not in the best-case scenario, but with real costs across the full stack: blank cost, print cost, platform fee, selling-channel fee, and ad spend. Walk through the math before you scale, and you'll know exactly what needs to be true for your store to be profitable. Skip it and you'll spend months moving revenue around while wondering why cash never accumulates.
The Full Cost Stack of a Single Shirt
There are five costs between a customer clicking "buy" and money landing in your account. Most guides mention the first one and wave at the others. All five shape your margin.
1. Blank Cost + Print Cost (Base Cost)
In print-on-demand, the blank shirt and the DTG printing are bundled into a single "base cost" charged by your platform. This is the number every platform advertises, and it's the floor of your cost structure — not your total cost.
Representative 2026 base costs for a standard unisex printed tee (size M, single front print):
| Platform | Free plan | Paid plan | Paid plan cost |
|---|---|---|---|
| Printify | ~$9.50 | ~$7.50 | ~$25/mo (Premium) |
| CustomCat | ~$9.00 | ~$7.00 | ~$30/mo (Pro) |
| Gelato | ~$10.00 | ~$7.50 | ~$20/mo (Gelato+ annual) |
| Printful | ~$12.50 | ~$10.50 | ~$25/mo (Growth) |
These figures assume a standard garment in a common colour. Larger sizes (2XL+) add $2–$4. A second print location (back print) adds another $3–$5. Dark garments on some platforms carry a small upcharge. Your real base cost for your specific product mix will sit somewhere in these ranges, and it's worth calculating the exact figure for every SKU you sell rather than using an average.
2. Shipping Cost
Shipping is billed per order by the platform and passed through to you. For a single t-shirt shipped to a US domestic address, expect roughly $3.99–$5.00 across most platforms. Most sellers either charge customers for shipping or build it into the product price and advertise free shipping.
The "free shipping" route is usually the stronger commercial choice — it reduces cart abandonment — but it means shipping is entirely your cost and must factor into your margin calculation. If you build in $4.50 as your shipping assumption, and an order goes to Alaska or Hawaii where rates are slightly higher, that's your problem, not the customer's.
International shipping changes the math significantly. A shirt shipped from a US fulfilment centre to a UK customer can cost $8–$12 and take 10–14 days. If you plan to sell internationally, either use a platform with local production (Gelato produces locally in 32 countries, keeping international shipping at roughly domestic rates) or price international orders to absorb the premium.
3. Selling Channel Fee
Where you sell shapes your per-order cost as much as which platform you print on.
Shopify (Basic, Shopify Payments): 2.9% + 30¢ per order. On a $26.99 sale that's $1.08 — clean and predictable.
Etsy: 6.5% transaction fee + ~3% + 25¢ payment processing + $0.20 listing fee = roughly $3.00 on a $26.99 sale. Add Etsy's optional offsite-ads fee (12–15% on orders Etsy markets for you) and a single sale can cost $4.00–$5.00 in channel fees alone.
Amazon Merch on Demand: Amazon sets the royalty structure — you earn a fixed royalty per sale that Amazon calculates. You don't set your own cost structure; Amazon does. The model is different from Shopify/Etsy and doesn't translate directly into a cost-per-order calculation.
For the rest of this guide we'll use Shopify Basic as the reference — it gives you full price control and the most predictable fee structure.
4. Paid Ad Spend (Customer Acquisition Cost)
This is the cost that makes or breaks a POD t-shirt business, and it's the one almost nobody quantifies before they start running ads.
Customer acquisition cost (CAC) is the amount you spend in ads to generate one paying customer. For a new POD store selling a $26.99 shirt through Meta or Google, a realistic CAC ranges from $8–$20 depending on niche, creative quality, and audience size. Broad niches (dog lovers, coffee fans) are competitive and expensive. Tight micro-niches (retired fire station dispatchers from Florida) can convert for much less with the right creative.
The brutal reality: at a $10 CAC, a shirt earning $11 gross profit leaves you $1.00. At a $15 CAC, you lose $4.00 per sale. The business only works on paid ads when gross profit per shirt comfortably exceeds your CAC — which means either a high sell price, a very low base cost, or an audience you've built and can reach without paying Meta every time.
5. Platform Subscription (Amortised Per Order)
If you're on a paid plan — Printify Premium, CustomCat Pro, Gelato+, or Printful Growth — you pay a monthly subscription that doesn't appear in your per-order fee but is a real cost of every order you ship. At 100 orders/month, a $25 subscription adds $0.25 per shirt. At 20 orders/month, it adds $1.25. Always amortise your subscription into your unit economics before evaluating whether a paid plan is worth it.
The Break-Even Math
Now let's put it together. Here's the full cost stack on a $26.99 shirt sold on a Shopify store (Basic plan), using Printify Free as the platform:
| Line item | Cost |
|---|---|
| Sell price | $26.99 |
| Base cost (Printify Free) | −$9.50 |
| Shipping (US domestic) | −$4.50 |
| Shopify payment fee | −$1.08 |
| Gross profit per shirt | $11.91 |
| Gross margin | 44.1% |
That $11.91 gross profit is your ceiling. Every dollar of ad spend comes off the top.
Organic vs Paid Traffic Break-Even
With organic traffic (Etsy search, social media, existing audience): No CAC. Net profit = $11.91 per shirt. That's a real, sustainable business.
With paid traffic at $8 CAC: $11.91 − $8.00 = $3.91 net profit per shirt. Thin but viable — if you can hold the CAC.
With paid traffic at $12 CAC: $11.91 − $12.00 = −$0.09 per shirt. You are losing money on every sale and generating revenue that feels like progress but isn't.
With paid traffic at $15 CAC: $11.91 − $15.00 = −$3.09 per shirt. At 200 orders a month, that's $618 lost monthly behind a dashboard showing healthy sales volume.
The break-even CAC for this shirt — the maximum you can spend acquiring a customer and still profit — is $11.91. Every dollar above that is a loss. This is the calculation most POD sellers never run before they start their first ad campaign.
Improving the Break-Even
Three levers move the break-even point meaningfully.
Raise the sell price. Moving from $26.99 to $31.99 adds $5 of pure margin on the same cost structure. That shifts break-even CAC from $11.91 to $16.91 — five extra dollars of room before ads turn unprofitable. Higher prices only work if your positioning supports them: a generic tee with a clip-art design won't hold at $31.99, but original artwork in a loyal community often can.
Lower the base cost. Upgrading to Printify Premium drops base cost from $9.50 to ~$7.50. After the $25/month subscription (at 100 orders = $0.25/order), you save roughly $1.75 per shirt. That's $1.75 more room on CAC, or $175 extra profit per month at 100 orders.
Increase average order value (AOV). The single most powerful lever. If a customer buys two shirts instead of one, your CAC stays the same but you earn gross profit on both items. At $11.91 per shirt, a two-item order generates $23.82 gross profit from the same $10 ad spend — a $13.82 net instead of $1.91. Bundles, cross-sells, and upsells don't change your cost per click; they change how much each click is worth.
Unit Economics at Different Sales Volumes
Here's what the business looks like at three stages of scale, using Printify Free, organic traffic only (no paid ads), and a $26.99 sell price:
| Monthly orders | Revenue | Total costs | Gross profit | Monthly net |
|---|---|---|---|---|
| 50 | $1,350 | $754 | $596 | $596 |
| 200 | $5,398 | $3,016 | $2,382 | $2,382 |
| 500 | $13,495 | $7,540 | $5,955 | $5,955 |
Costs = (base $9.50 + shipping $4.50 + fee $1.08) × orders. No subscription, no ad spend.
Add a $25/month Printify Premium subscription at 200 orders and drop base cost to $7.50:
| Monthly orders | Revenue | Total costs | Gross profit | Monthly net |
|---|---|---|---|---|
| 200 | $5,398 | $2,641 | $2,782 | $2,757 |
| 500 | $13,495 | $6,490 | $7,030 | $7,005 |
The subscription pays for itself at roughly 14 orders a month and adds ~$375/month in extra profit at 200 orders. That's the kind of math worth running before you decide whether to upgrade.
The Traffic Problem: Why Organic Changes Everything
The unit economics above look appealing — under one condition: you can drive traffic without paying $15 per click. Organic traffic is the variable that separates a POD business that works from one that bleeds cash.
Etsy organic search is the most reliable channel for new POD sellers. A well-optimised listing in a low-competition niche generates consistent sales at zero CAC — your cost structure is just base cost + shipping + Etsy fees (~$3.00), leaving roughly $10.00 net per shirt.
Social media organic (TikTok, Instagram Reels, Pinterest) can drive volume at zero CAC when the right content connects, but it's inconsistent — a viral video can spike 500 orders in a week and go quiet for two months.
Email and community is the highest-margin channel at scale — a seller with an engaged audience reaches customers they already own, at a CAC of effectively zero.
Paid ads work as an amplifier once you know which designs convert and what your break-even CAC is. They rarely work as a starting strategy for a $26.99 shirt with $11.91 gross profit unless you push AOV above $50.
The Business Model Viability Test
Before you invest in a POD t-shirt store, answer three questions with real numbers:
1. What is my realistic gross profit per shirt? Run the full calculation: sell price − base cost − shipping − channel fee. Use your actual sell price for your specific niche, not a wishful one.
2. What is my realistic CAC? Organic: $0, but be honest about how long it takes to build traffic. Paid: use $10–$15 as a planning assumption, not $3.
3. Does gross profit exceed realistic CAC with room to spare? If gross profit is $11 and CAC is $10, you have $1 per shirt — one algorithm change wipes you out. You need a higher sell price, lower base cost, or a non-paid traffic strategy before you scale.
Know Your Real Numbers on Every Order
Running these calculations once before launch is the right start. Running them on every order, automatically, is what profitable POD sellers do at scale — because base costs change, ad costs drift, shipping rates shift, and a product that earned $11 per shirt three months ago might be earning $6 today with no obvious signal anywhere in your dashboard.
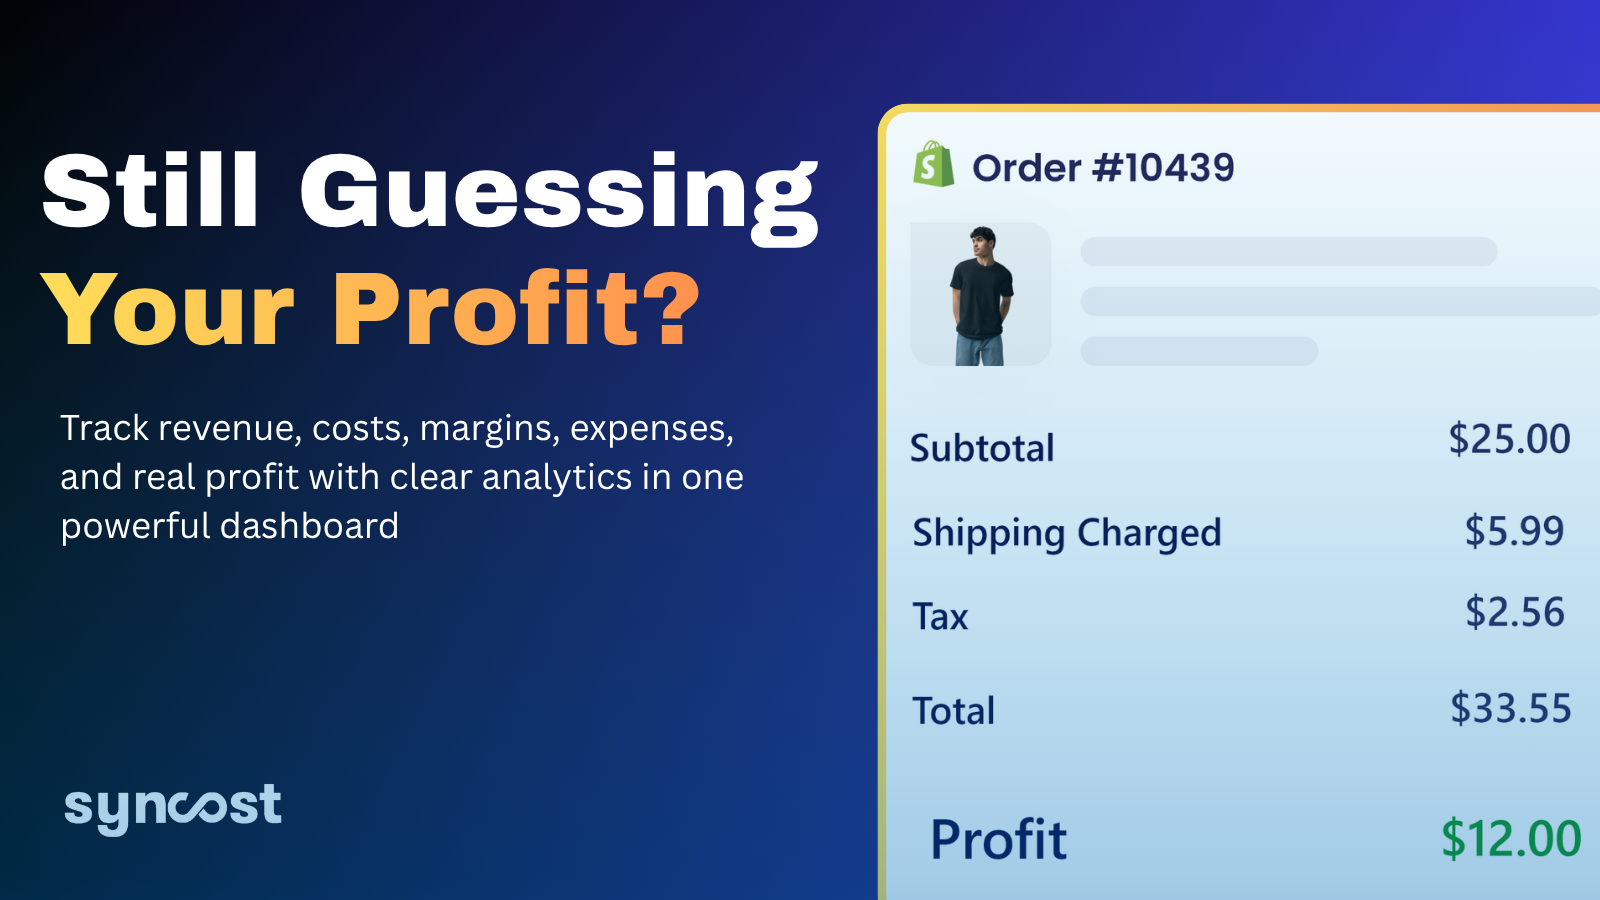
That's the gap Syncost closes for Shopify merchants. It automatically pulls your product costs, shipping, Shopify fees, and ad spend into one clear view, so you see true net profit on every single order — not a gross estimate, not a spreadsheet you update manually once a month. It's the tool that makes "will this business model work?" a question you answer with live data rather than back-of-envelope math. Build your unit economics with the numbers in this guide, then use Syncost to confirm you're hitting them on every order you ship.
Cost figures are representative 2026 estimates and vary by platform, garment, size, destination, and plan. Verify current pricing with your chosen POD platform before making business decisions.