The Multi-Channel Attribution Trap: Why Blended MER Beats Platform ROAS Every Time
Relying on Facebook and Google's in-platform ROAS will systematically bankrupt your scaling e-commerce brand. Discover how attribution overlap double-counts your revenue, and why Marketing Efficiency Ratio (MER) is the only metric that reveals your true net operating profit.

The Hook & The Silent Problem
It is the end of Q3, and your media buyer is ecstatic. According to your Meta Ads Manager, your campaigns are yielding a 3.5x Return on Ad Spend (ROAS). Over on Google Ads, your Performance Max campaigns are claiming a 4.2x ROAS. You aggressively scale your daily budgets, confident that you have unlocked the holy grail of infinite, profitable customer acquisition. Your Shopify dashboard shows a massive spike in top-line revenue, validating your aggressive capital allocation.
Then, you check your operating bank account. The cash reserves are terrifyingly low.
You pull your bank statements, pay your suppliers, cover your 3PL fulfillment invoices, and pay your credit card bill for the ad spend. The math doesn't make sense. If you are generating a 3.5x to 4x return on every dollar spent, why are you barely breaking even?
You are a victim of the Multi-Channel Attribution Trap. Because you are driving traffic from multiple ad networks, a single customer is interacting with both platforms before purchasing. A prospect clicks a Facebook ad on Tuesday, searches for your brand on Google on Thursday, clicks a branded search ad, and buys your product. Meta takes 100% of the credit for the sale. Google takes 100% of the credit for the sale. Your platforms are artificially inflating your revenue by double-counting conversions, leading your team to scale "profitable" campaigns that are actually bleeding your business dry.
Core Concept Explained (The Quick Answer)
The Multi-Channel Attribution Trap occurs when individual advertising platforms claim isolated, overlapping credit for the same conversion, causing merchants to over-report ad efficiency and overspend on acquisition. To survive, e-commerce CFOs abandon siloed Platform ROAS and optimize for Marketing Efficiency Ratio (Blended MER)—a holistic metric calculated by dividing total store revenue by total combined ad spend across all channels, revealing the true macroeconomic health of the business.
The Deep-Dive Reference Guide
To operate a highly liquid, cash-flow-positive DTC brand, you must stop allowing ad platforms to grade their own homework. Transitioning from an amateur media-buyer mindset to a CFO mindset requires a fundamental shift in how you view acquisition data:
| Metric Paradigm | The Amateur Assumption (The Trap) | The CFO Reality (True Financial Impact) |
|---|---|---|
| In-Platform ROAS | "If Meta says 3x ROAS, I made $3 for every $1 spent." | Meta uses a 7-day click/1-day view attribution window. It claims credit for organic buyers, returning customers, and users who ultimately converted via Google. It is a vanity metric that ignores operational reality. |
| Multi-Touch Attribution (MTA) | "Software can perfectly track the customer journey." | With iOS 14.5, cookie deprecation, and cross-device browsing, pixel tracking is fundamentally broken. Trying to assign fractional credit to specific ads creates complex, unreliable data models that do not reflect cash in the bank. |
| Marketing Efficiency Ratio (MER) | "MER is too broad; it doesn't tell me which ad to turn off." | Blended MER is the ultimate source of truth. It measures total cash generated against total cash burned. If your MER is above your breakeven threshold, the business is profitable. If it drops, you are losing money, regardless of what Facebook claims. |
| New Customer Acquisition Cost (nCAC) | "Overall CAC is fine as long as revenue is up." | Blended CAC blends cheap returning customers with expensive new ones. You must isolate nCAC to understand exactly what it costs to buy net-new market share before factoring in lifetime value (LTV). |
Technical Breakdown & Formulas
You cannot manage capital allocation based on feelings or platform dashboards. You must build your financial models using absolute mathematical truth.
[Formula 1: The Platform ROAS Illusion]
Platform_Reported_Revenue = (Meta_Reported_Revenue + Google_Reported_Revenue + TikTok_Reported_Revenue)
* This number will almost always exceed your actual Shopify Gross Revenue due to overlapping attribution windows.

[Formula 2: Marketing Efficiency Ratio (MER)]
MER = Total_Gross_Sales / Total_Blended_Ad_Spend

[Formula 3: True Net Operating Profit using MER]
Net_Profit_$ = Total_Gross_Sales
             - Total_Blended_Ad_Spend
             - Total_Landed_COGS
             - Total_Fulfillment_And_Shipping_Costs
             - Operating_Overhead (Software, Payroll, Merchant Fees)

[Formula 4: Breakeven MER Target]
Breakeven_MER = 1 / Gross_Margin_%
* If your Gross Margin (after COGS and Fulfillment) is 60%, your Breakeven MER is 1 / 0.60 = 1.66.
* You must generate $1.66 in total revenue for every $1 spent on ads just to break even.
The Breakeven MER Rule: The most critical number in your entire e-commerce business is your Breakeven MER. If your true Gross Margin (after landed COGS, pick/pack fees, and shipping) is 50%, your Breakeven MER is 2.0. If your Blended MER drops to 1.9, your ad accounts might still be showing a 3x ROAS, but your business is actively losing cash on every order.
The Scaled Financial Impact (What It Actually Costs You)
Let’s analyze a highly realistic scenario exposing how relying on platform ROAS quietly destroys an 8-figure brand's scaling phase.
You operate a premium nutritional supplement brand.
- Average Order Value (AOV): $100.00
- True Gross Margin: 60% ($60 profit after product, shipping, and fulfillment).
- Breakeven MER Threshold: 1.66 (1 / 0.60)
The Illusion (The ROAS Mindset)
In November, you spend heavily to capture holiday traffic.
- Meta Ads Spend: $50,000 (Reports 3.0x ROAS = $150,000 "Revenue")
- Google Ads Spend: $30,000 (Reports 4.0x ROAS = $120,000 "Revenue")
- Total Platform "Reported" Revenue: $270,000.
Your media buyer celebrates. You spent $80,000 to make $270,000. That’s a 3.37x Blended ROAS. You assume you made a fortune and authorized a budget increase for December.
The CFO Reality (The MER Bleed)
You log into your Shopify analytics and your bank account. You did not make $270,000. Because 45% of your customers clicked a Meta ad to discover the product, but then searched Google to buy it a week later, both platforms claimed the same $100 sale.
- Actual Shopify Gross Sales: $125,000 (You only sold 1,250 units, not 2,700).
- Total Blended Ad Spend: $80,000.
Let's calculate your true profitability:
- Actual Blended MER: $125,000 / $80,000 = 1.56
- Gross Margin Dollars (1,250 units * $60): $75,000
- Total Ad Spend: -$80,000
- True Net Operating Profit: -$5,000
The Scaled Discrepancy
Your ad platforms hallucinated $145,000 in phantom revenue due to attribution overlap. Because your actual Blended MER (1.56) fell below your Breakeven MER threshold (1.66), you didn't print money—you lost $5,000 in hard cash.
The Financial Impact: By ignoring your macro Blended MER and blindly scaling based on isolated platform ROAS, you aggressively spent money into unprofitability. At scale, this attribution trap is the number one reason 7-figure brands file for bankruptcy despite having "profitable" Facebook ad accounts.
Strategic Execution (How to Apply This to Your Business)
To escape the attribution trap and scale with absolute financial certainty, execute this workflow to transition your entire media buying operation to an MER-based model:
-
Calculate Your True Breakeven MER: Establish absolute truth. Before spending another dollar on ads, audit your true Landed COGS, pick/pack fees, outbound shipping, and payment gateway fees. Determine your exact Net Gross Margin per order. Divide 1 by your Gross Margin percentage to establish your absolute baseline Breakeven MER.
-
Implement Daily Blended Tracking: Change the daily KPI. Ban your media buying team from reporting on in-platform ROAS as a primary success metric. Require a daily report that takes Total Shopify Revenue divided by Total Combined Ad Spend (Meta + Google + TikTok). If this Blended MER drops below your target, total spend must be reduced immediately.
-
Demote ROAS to a Micro-Optimization Metric: Use platforms directionally. In-platform ROAS should only be used to compare ad creatives against one another within the same platform. If Ad A has a 2x ROAS and Ad B has a 1x ROAS, Ad A is better. But you cannot use that 2x ROAS to determine the macro profitability of the company.
-
Track nCAC (New Customer Acquisition Cost): Isolate new growth. Separate returning customer revenue from net-new customer revenue. Divide your total ad spend purely by the number of first-time buyers. This reveals exactly how much capital you are burning to acquire fresh market share, completely insulated from the inflated metrics of organic repeat purchases.
Frequently Asked Questions (FAQ)
What is the difference between ROAS and MER?
Return on Ad Spend (ROAS) is a micro-metric reported by an individual advertising platform (like Meta or Google) that measures the revenue they claim to have generated against the spend on their platform. Marketing Efficiency Ratio (MER) is a macro-metric calculated by dividing your total store revenue across all channels by your total cumulative ad spend. MER is the ground truth of your business's marketing profitability.
Why do Facebook and Google over-report my sales?
Ad platforms operate on "last-click" or "view-through" attribution windows (e.g., 7-day click, 1-day view). If a user sees your ad on Facebook on Monday, but clicks a Google Search ad and buys on Thursday, both platforms will record the full revenue of that sale in their dashboards. Because they operate in silos, they do not communicate to deduplicate the conversion, resulting in massively inflated revenue numbers.
What is a "good" Blended MER for an e-commerce store?
There is no universal "good" MER, as it depends entirely on your specific profit margins. A brand with 85% gross margins (like digital products or cosmetics) might be highly profitable at a 1.5 MER. A brand with 40% gross margins (like dropshipping or heavy electronics) will go bankrupt at a 2.0 MER and may require a 3.0+ MER just to break even. Your target MER must be reverse-engineered from your unique cost structure.
From Financial Chaos to Verified Profit
Trying to scale a multi-channel e-commerce brand using isolated dashboard metrics is like trying to fly a commercial jet using a broken compass. When you allow Meta and Google to dictate your financial reality, you scale overlapping attribution into catastrophic cash flow crunches. Surviving the modern landscape of customer acquisition requires absolute, top-down visibility into your unified revenue, true landed COGS, and real-time Blended MER.
This is exactly why elite, profitability-obsessed e-commerce operators abandon disjointed spreadsheets and integrate Syncost into their operational tech stack.
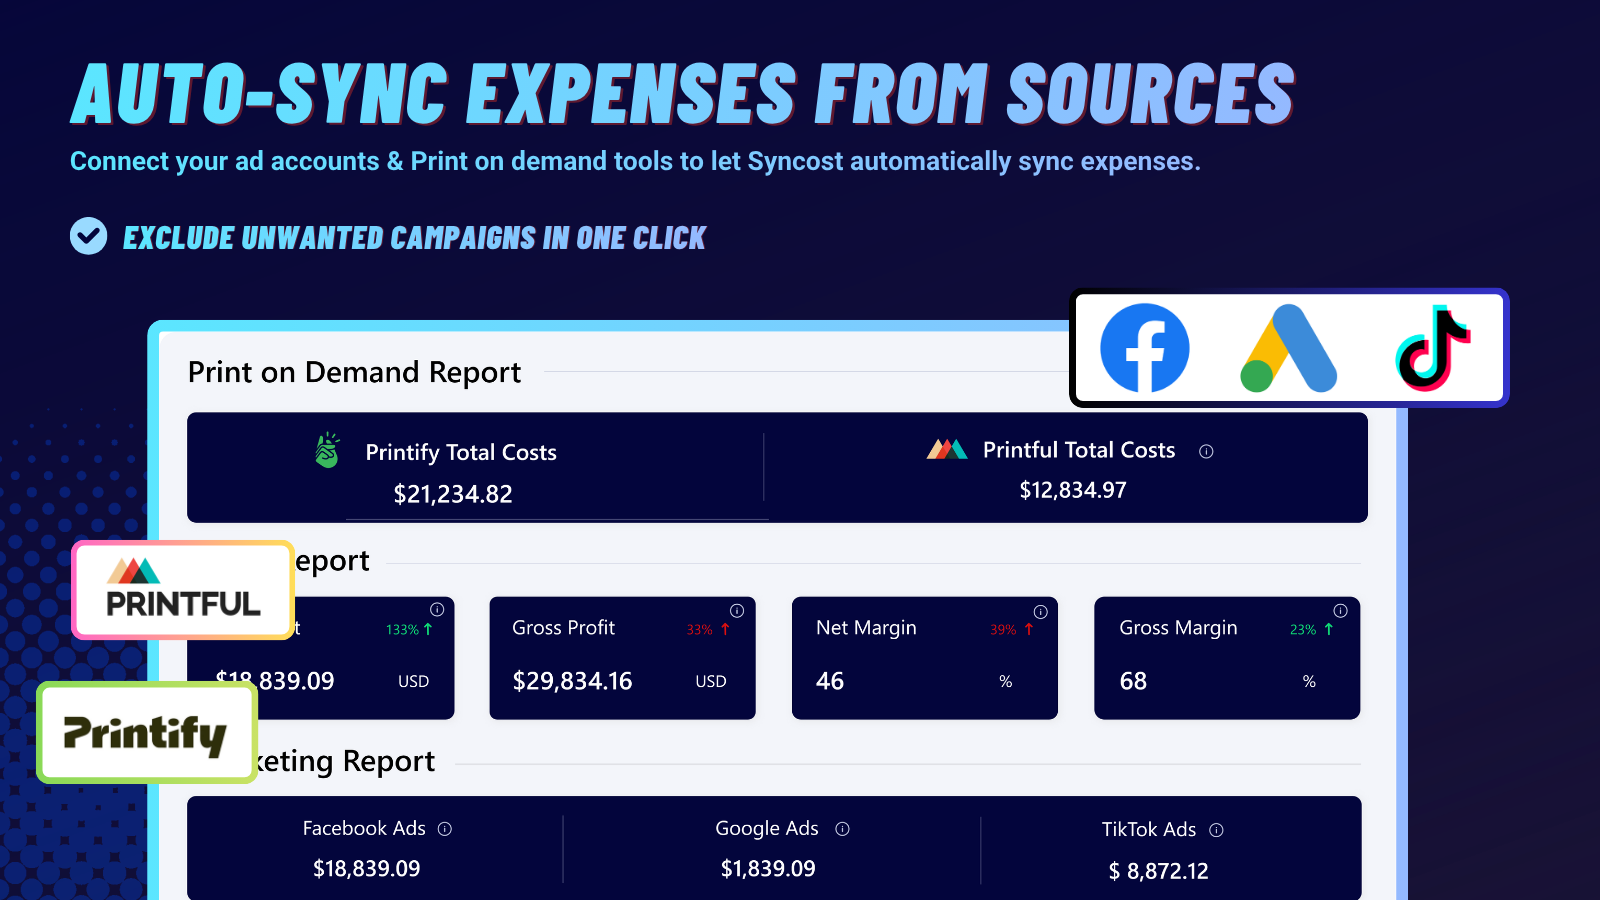
Syncost completely neutralizes the Multi-Channel Attribution Trap. By pulling in your true top-line Shopify revenue and syncing it instantly with your combined ad spend across all platforms, Syncost calculates your exact Blended MER in real-time. But it goes deeper—by factoring in your precise landed COGS, true fulfillment costs, and unrecoverable merchant fees, Syncost reveals your exact, order-level net profit.
Stop letting ad platforms grade their own homework and artificially inflate your success. Install Syncost today, establish your true Breakeven MER, and scale your acquisition with the ruthless precision of a Fortune 500 CFO.