The Ghost Margin Trap: Why Your E-Commerce Dashboard is Hiding Thousands in Profit Leakage
Most e-commerce founders scale their brands straight into bankruptcy because they confuse top-line revenue with bottom-line reality. Discover the hidden cost variables silently destroying your margins and how to calculate your true net profit down to the exact cent.

The Hook & The Silent Problem
There is a quiet epidemic in the e-commerce industry, and it happens when founders obsess over top-line revenue while remaining completely blind to their bottom-line unit economics. You launch a campaign, watch the Shopify dashboard light up with six figures in sales, and assume your business is wildly profitable. But 45 days later, when supplier invoices, ad platform credit cards, and fulfillment center bills clear, your bank account is suspiciously empty.
This is the "Ghost Margin" phenomenon. It is the insidious gap between the profit you think you are making and the actual cash you retain. Standard e-commerce platforms are built to sell you dopamine, highlighting gross sales while obfuscating the granular, cascading costs of doing business. Unaccounted payment gateway fees (often higher on international cards), fluctuating pick-and-pack fulfillment charges, hidden supplier freight hikes, and return processing logistics silently eat away at your margins. If you are operating on a razor-thin 15% net margin, a 3% leak in unaccounted fulfillment costs doesn’t reduce your profit by 3%—it obliterates 20% of your total net income. Scaling a flawed financial model does not create a larger business; it creates a larger financial catastrophe.
Core Concept Explained (The Quick Answer)
True Net Profit Margin is the absolute percentage of revenue remaining after subtracting every single variable and fixed operational cost—including landed COGS, dynamic fulfillment fees, payment gateway cuts, blended marketing acquisition costs, and reverse logistics. Contribution Margin, a vital secondary metric, defines the profit generated by an individual order strictly after subtracting variable costs, serving as the financial baseline to determine if a product is actually viable to scale.
The Deep-Dive Reference Guide
To transition from an amateur seller to a financially literate operator, you must abandon surface-level metrics. Use this reference matrix to recalibrate how you view your store's performance data.
| Financial Metric | Surface Calculation (The Trap) | True Calculation (The CFO Reality) |
|---|---|---|
| Cost of Goods Sold (COGS) | Factory invoice cost per unit. | Factory cost + inbound freight + customs duties + warehouse receiving fees + raw material inflation buffers. |
| Customer Acquisition Cost (CAC) | Facebook Ad Spend ÷ Facebook Attributed Sales. | Total Marketing Spend (Ads + Agencies + Software + Content) ÷ Total New Customers Acquired. |
| Fulfillment Costs | Flat rate quoted by your 3PL. | Pick & pack base fee + dimensional weight surcharges + packaging materials + residential delivery premiums. |
| Payment Processing | Assuming a flat 2.9% + $0.30 fee. | Blended rate accounting for cross-border fees, Amex surcharges, and chargeback penalty reserves. |
| Revenue | Gross Sales displayed on Shopify. | Gross Sales minus discounts, minus refunds, minus store credit liabilities, minus uncaptured taxes. |
Technical Breakdown & Formulas
To master your finances, you must map your exact unit economics using uncompromising mathematical formulas.
True Net Profit = Gross Revenue - (Landed COGS + Variable Fulfillment Costs + Payment Gateway Fees + Total Ad Spend + Operational Overhead + Return Allowances)

Contribution Margin ($) = AOV - (Landed COGS + Pick/Pack/Ship Fees + Gateway Fee + Variable Ad Spend per Order)

Breakeven ROAS = 1 / (Contribution Margin % Before Ad Spend)
Gross Revenue: The total cash collected before any deductions. This must be adjusted for sales tax and VAT, which is a liability you owe the government, not cash you own. Landed COGS: The true cost of your product sitting on the warehouse shelf ready to ship. If a manufacturer charges $10 per unit, but sea freight costs $2,500 for a 1,000-unit pallet, and customs takes 5%, your Landed COGS is exactly $13.00, not $10.00. Return Allowances: A historical average of the cost to process a return. If your return rate is 5%, and a return costs $15 in dead shipping and unsellable goods, you must amortize a $0.75 penalty against every single order dispatched. Breakeven ROAS: The exact Return on Ad Spend multiplier required just to not lose money. If your product has a 60% gross margin after COGS and shipping, your Breakeven ROAS is 1 / 0.60 = 1.66x. Anything below this is scaling a loss.
The Scaled Financial Impact (What It Actually Costs You)
Let’s examine the catastrophic compounding effect of Ghost Margins as an e-commerce brand scales from a micro-operation to a mid-market enterprise.
Assume your Average Order Value (AOV) is $100. You mistakenly calculate your total variable costs per order at $60 (giving you a $40 profit margin before ads). Based on this, you are aggressively willing to spend $30 to acquire a customer (CAC), leaving you with a $10 net profit per order.
At 100 Units per Month (The Illusion):
- Calculated Profit: 100 * $10 = $1,000.
- You don't notice the missing margins because the volume is too small to cause a cash flow crunch.
However, you failed to include: a 1.5% international gateway fee surcharge ($1.50), a recent $0.75 hike in dimensional weight shipping, a $1.25 amortized cost for returns, and $2.00 in un-tracked packaging inserts. Your real variable cost is actually $65.50.
- True Profit per Order: $100 AOV - $65.50 Costs - $30 CAC = $4.50.
At 5,000 Units per Month (The Reality Check): You secure capital and scale your ad spend aggressively to hit 5,000 units, believing you are generating $50,000 in net profit. But at scale, marketing efficiency drops. Your CAC creeps up from $30 to $34 as you exhaust warm audiences.
- Calculated "Ghost" Profit: 5,000 units * $6 (projected margin) = $30,000.
- True Profit at Scale: 5,000 units * ($100 AOV - $65.50 Real Costs - $34 Scaled CAC) = $2,500.
By missing just $5.50 in hidden unit costs, you over-leveraged your ad spend. Instead of the $50,000 war chest you projected, you generated a negligible $2,500 in profit while taking on the massive operational risk of moving 5,000 units. You missed out on $47,500 in expected capital, likely leaving you unable to fund your next inventory purchase order.
Strategic Execution (How to Apply This to Your Business)
To eliminate profit leakage, implement these operational workflows immediately:
- Conduct a Deep-Scrape Cost Audit: Pull your last 30 days of actual bank statements, not just dashboard figures. Map every dollar that left the account directly to its origin. You will likely uncover software subscriptions you don't use, agency fees that aren't yielding ROI, and supply chain minimum-order penalties.
- Standardize Landed COGS Updates: Do not set your COGS once a year. Freight rates and raw materials fluctuate wildly. Establish a monthly workflow on the 1st of every month to recalculate Landed COGS based on the most recent container receipt.
- Implement Rigid Blended Marketing Caps: Stop looking at in-platform ROAS (Facebook/Google). Look only at MER (Marketing Efficiency Ratio), which is Total Revenue divided by Total Marketing Spend. Set a hard floor—if MER drops below a specific threshold (e.g., 3.0), ad spend must be aggressively throttled, regardless of what the media buyer says.
- Isolate and Monetize Returns: Treat reverse logistics as a separate P&L. Track the exact labor and shipping cost of a return. Implement strategic friction—like deducting return shipping costs from the customer's refund or pushing them toward store credit via a bonus incentive—to mitigate these losses.
Frequently Asked Questions (FAQ)
What is a good net profit margin for an e-commerce brand?
A healthy, scalable direct-to-consumer (DTC) e-commerce brand should target a true net profit margin of 15% to 20% after all expenses, including operational overhead and owner salaries. Anything below 10% places the business at severe risk during inventory restock cycles or sudden jumps in advertising costs.
Why is my actual bank payout always lower than my e-commerce dashboard revenue?
Dashboards highlight Gross Sales. They routinely fail to instantly deduct real-time gateway processing fees (typically 2-4%), rolling payment reserves held by processors like Stripe or Shopify Payments, applied discount codes, and the liability of collected sales taxes which are remitted later.
How do I calculate my Blended Customer Acquisition Cost (CAC)?
Do not rely on the ad platform's attributed cost per purchase. To calculate Blended CAC, take your total marketing and sales expenses for a given period (Ad spend across all platforms + agency fees + content creation costs + promotional software) and divide it by the total number of new, unique customers acquired in that same period.
Should I prioritize Gross Margin or Net Margin when choosing products?
While Net Margin dictates your actual take-home cash, Gross Margin is the critical gatekeeper. You should aim for a minimum of a 70% Gross Margin (Cost of Goods vs Retail Price) to ensure you have enough mathematical "room" to absorb high digital acquisition costs and shipping fees while still yielding a double-digit Net Margin.
From Financial Chaos to Verified Profit
Manually tracking the cascading complexities of landed COGS, shifting fulfillment rates, and blended ad spends on static spreadsheets is a guaranteed path to data entry errors and financial blindness. The speed of modern e-commerce requires financial infrastructure that operates in real-time, pulling raw data straight from the source to give you an unshakeable view of your unit economics.
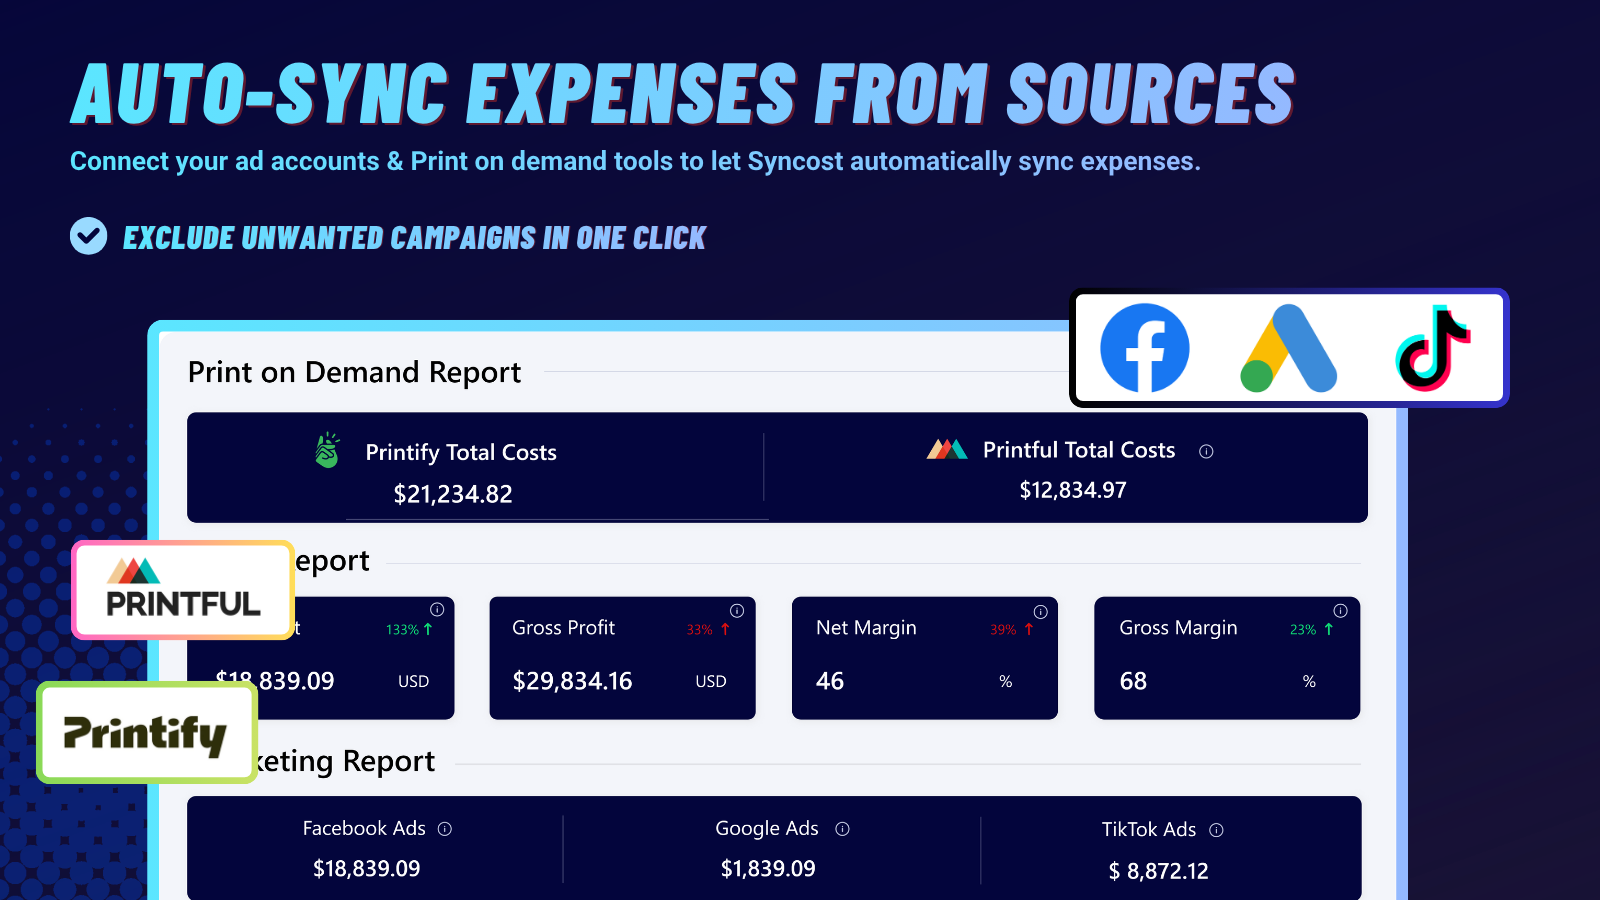
This is exactly why high-performing merchants rely on Syncost. Built for operators who demand extreme financial clarity, Syncost seamlessly integrates your storefronts, ad platforms, and supply chain data—including exact Printify/Printful product sourcing costs—into a single source of truth. It bypasses flawed dashboard vanity metrics, offering rigorous cost analysis and real-time profit tracking. With Syncost, you instantly transition from guessing your margins to executing data-driven scaling decisions based on absolute, bottom-up net profit truth. Stop operating in the dark. Let Syncost uncover your hidden costs and secure your bottom line.