Cost of Goods Sold (COGS): How to Calculate It for Your Store
Most merchants include only the supplier invoice in COGS — missing inbound freight, duties, and 3PL fees that can add $0.40–$2.00 per unit to true landed cost. Here's the correct COGS calculation for inventory stores (FIFO and weighted average), dropshippers, and POD sellers, plus the Shopify cost-field error that silently overstates gross margin on every sale.

Cost of goods sold is the number that determines whether your store is actually profitable or just generating revenue. Get it right and every margin calculation downstream is meaningful. Get it wrong — or skip it entirely — and your gross margin, your P&L, and every pricing decision you make are built on a number that isn't real.
Most ecommerce merchants either undercount their COGS (by including only the supplier invoice and nothing else) or miscalculate it (by confusing what they bought with what they sold). Both errors overstate gross margin and lead to pricing that looks profitable until it isn't. This guide covers the correct COGS calculation for every ecommerce business model — standard inventory, dropshipping, and print-on-demand — plus the common mistakes that silently inflate the number you think you're making.
What Cost of Goods Sold Is
Cost of goods sold is the direct cost of the products you sold during a period — not the products you bought, not the products in your warehouse, but specifically the ones that left your store and reached customers.
COGS is a matching concept: the cost is recognised in the same period as the revenue it produced. If you bought 100 units in January and sold 60 in January, your January COGS is the cost of 60 units — not 100. The cost of the remaining 40 units sits on your balance sheet as inventory until they're sold, at which point their cost becomes COGS.
This matching principle is what makes COGS the foundation of gross margin:
Gross profit = Net revenue − COGS
Gross margin % = Gross profit ÷ Net revenue × 100
Every percentage point of COGS accuracy translates directly into gross margin accuracy — which translates into every pricing, scaling, and supplier decision you make.
What Belongs in COGS (and What Doesn't)
This is where most merchants go wrong. COGS isn't just the supplier invoice. It's every cost directly required to bring the product into a state ready for sale.
What Belongs in COGS
Product cost: The per-unit price you pay your supplier or manufacturer. This is the core component and the one everyone includes.
Inbound freight and shipping: The cost of getting the product from your supplier to your warehouse or fulfilment centre. A shipment of 500 units at $8 each costs $4,000 in product cost. If the freight to receive that shipment was $200, the true landed cost per unit is $4,200 ÷ 500 = $8.40 — not $8.00. Using only the supplier invoice understates your per-unit COGS by $0.40 on every unit sold.
Import duties and customs fees: If you source internationally, import duties, tariffs, and customs brokerage fees are a direct cost of acquiring the product and belong in COGS.
Packaging materials directly tied to the product: Branded boxes, tissue paper, product-specific inserts, and hang tags that are purchased per unit or consumed per unit sold are COGS. Generic office supplies and tape are not.
3PL receiving fees: If your third-party logistics provider charges per-unit receiving fees when your inventory arrives, these are a direct cost of getting units into a sellable state.
What Does Not Belong in COGS
Outbound shipping to customers: The cost of delivering to your customer is a cost of sale but not a cost of goods — most accounting standards treat it as a separate line in variable operating costs or selling expenses. Some businesses include it in COGS; others don't. The key is consistency — pick an approach and apply it the same way every period.
Payment processing fees: A cost per transaction, not a cost per product unit. Goes in operating expenses.
Advertising and marketing spend: Costs of acquiring the customer, not of producing the product.
Shopify subscription and app fees: Platform overhead, not product cost.
Warehouse rent and utilities: These are operating expenses unless you're running a manufacturing operation where facility costs are allocated to production.
The COGS Formula for Inventory-Holding Stores
For merchants holding physical inventory, COGS requires tracking what's sold versus what's held:
COGS = Opening inventory + Purchases in period − Closing inventory
Worked Example
A clothing store opens the month with $12,000 of inventory (at cost). During the month, they receive $8,500 in new inventory from suppliers. At month end, a stocktake shows $9,200 of inventory remaining.
COGS = $12,000 + $8,500 − $9,200 = $11,300
They sold $11,300 worth of product (at cost) during the month. If net revenue was $28,500, gross margin is ($28,500 − $11,300) ÷ $28,500 = 60.4%.
This formula works regardless of inventory method — it's the bookkeeping mechanic that produces COGS. The cost figures that flow into it depend on which inventory costing method you use.
Inventory Costing Methods: FIFO, LIFO, and Weighted Average
When you buy units at different prices over time, which cost do you assign to the units you sell? Three methods give three different answers.
FIFO (First In, First Out)
FIFO assumes the first units purchased are the first ones sold. This generally matches physical reality for most ecommerce products (you ship older stock first to avoid expiry issues or outdated versions).
Example: You buy 100 units at $8.00 in January and 100 units at $9.50 in February. In March you sell 150 units. FIFO assigns the first 100 sold at $8.00 and the next 50 at $9.50.
COGS = (100 × $8.00) + (50 × $9.50) = $800 + $475 = $1,275
Remaining inventory: 50 units at $9.50 = $475
FIFO is the most common method for ecommerce and the one most accounting software defaults to. It produces higher gross profit in periods of rising costs (because older, cheaper inventory is expensed first) and lower gross profit in periods of falling costs.
Weighted Average Cost
Weighted average assigns a single blended cost to all units — the average of what everything in inventory cost, weighted by quantity.
Same example:
Total units: 200 (100 at $8.00, 100 at $9.50)
Total cost: $800 + $950 = $1,750
Weighted average cost: $1,750 ÷ 200 = $8.75 per unit
COGS (150 units sold): 150 × $8.75 = $1,312.50
Weighted average smooths the impact of price fluctuations, producing more consistent COGS and gross margin figures month to month. It's simpler to administer than FIFO because you don't need to track which specific batch each sold unit came from.
LIFO (Last In, First Out)
LIFO assumes the most recently purchased units are sold first. It's rarely used in ecommerce (and not permitted under IFRS, the international accounting standard) because it produces results that don't match physical inventory flow and, in periods of rising costs, results in significantly lower gross profit.
For most Shopify merchants: Use weighted average cost for simplicity, or FIFO if your accounting software defaults to it. Consult your accountant before changing methods — switching between methods requires a restatement.
COGS for Dropshippers
Dropshipping simplifies COGS calculation significantly. Because you never hold inventory, there's no opening/closing inventory adjustment. Every order placed with your supplier for a customer sale is COGS — matched to the revenue from that same order.
COGS per order = Supplier cost per unit for fulfilled orders
What to Include
Supplier product cost: What the supplier charged per item in the fulfilled order — the primary COGS line.
Supplier shipping: If your supplier charges shipping to the end customer as part of the fulfilment cost, this belongs in COGS (or in outbound shipping as a variable cost — apply consistently).
Platform fees from your supplier: If you use a dropshipping platform (Zendrop, CJ Dropshipping, AutoDS) that charges per-order fees on top of product cost, those fees are COGS — they're a direct cost of fulfilling the sale.
The Dropshipping COGS Mistake
The most common dropshipping COGS error is recording supplier payments in bulk when they're charged (monthly or weekly) rather than attributing them to specific orders. This creates a mismatch between when COGS is recorded and when revenue is recognised, distorting your margin in any period where order volume changes significantly.
The correct approach: record COGS when the order is fulfilled and the supplier charges you — which, in dropshipping, happens nearly simultaneously with the sale.
COGS for Print-on-Demand Sellers
Print-on-demand has the simplest COGS calculation of any ecommerce model because the platform charges you per fulfilled order with no inventory to track.
COGS per order = Platform base cost (product + print) for that specific order
For Printify, Printful, Gelato, or any POD platform, every invoice for a fulfilled order is COGS, charged at the exact moment of fulfilment.
POD COGS by Platform (Representative 2026 Figures)
| Platform | Standard unisex tee base cost | Notes |
|---|---|---|
| Printify (Free) | ~$9.50 | Varies by provider |
| Printify (Premium, ~$25/mo) | ~$7.50 | 20% discount |
| Gelato (Free) | ~$10.00 | Local production |
| Gelato+ (~$20/mo) | ~$7.50 | 25% discount |
| Printful (Free) | ~$12.50 | In-house production |
| Printful (Growth, ~$25/mo) | ~$10.50 | Up to 22% discount |
Figures are representative — actual costs vary by product type, size, colour, and fulfilment location.
The Subscription Plan Complication in POD COGS
If you're on a paid POD plan (Printify Premium, Gelato+, Printful Growth), the subscription fee is a fixed monthly cost that reduces your per-unit base cost. How you treat it in accounting matters for margin accuracy.
Option A — Treat subscription as fixed operating cost, use discounted base cost as COGS: The subscription is overhead; COGS reflects the actual per-order charge (already discounted). This is the cleaner approach and produces accurate gross margin.
Option B — Amortise subscription into COGS per order: Divide the monthly subscription by your monthly order count and add it to per-order COGS. At 200 orders/month and a $25/month subscription, add $0.125 per order to COGS. More precise for unit-level margin analysis.
Either approach is defensible — use Option A for P&L reporting and Option B for per-order margin analysis.
COGS in Shopify: The Static Cost Field Problem
Shopify stores a cost-per-item in each product variant's details (Products → [product] → Cost per item). This field powers the gross margin report in Shopify analytics.
The problem: This field is static. It doesn't update when your supplier changes prices, when you negotiate a new rate, or when a new season's purchase cost differs from the last. A supplier price increase that happened three months ago — never entered into Shopify — means every gross margin figure Shopify has shown you since that date is overstated.
How to keep it current:
- Update the cost-per-item field every time your supplier invoices at a new price
- Build a quarterly review into your workflow to verify cost fields against current invoices
- For weighted average costing, update the field to your current weighted average when a new purchase order arrives at a different price
A product costing you $8.50 but showing $7.00 in the Shopify cost field overstates gross margin by 6.0 percentage points at a $25 sell price. Across your bestselling SKUs, uncorrected cost fields can make the business look significantly more profitable than it is — until reality arrives in a bank statement.
COGS Across Multiple Suppliers and Products
Larger stores with multiple suppliers and product categories need to track COGS at the SKU or category level rather than as a single blended figure. A blanket average COGS across all products hides the margin profile of individual products — which is exactly the information you need to make merchandising, marketing, and sourcing decisions.
Minimum useful COGS breakdown:
- COGS by product (or at least by product category)
- COGS by supplier (reveals which supplier relationships are most cost-efficient)
- COGS trend over time (surfaces supplier cost drift before it becomes a margin problem)
The goal isn't just to know what you paid — it's to know which products and suppliers are giving you the best economics, and to catch when that changes before it shows up as a margin compression in a monthly P&L.
From COGS to Real Per-Order Profit
Accurate COGS gives you gross margin. What it doesn't give you is net profit per order — because gross margin doesn't include shipping, processing fees, ad spend, or platform overhead. All of those costs sit below COGS in the P&L.
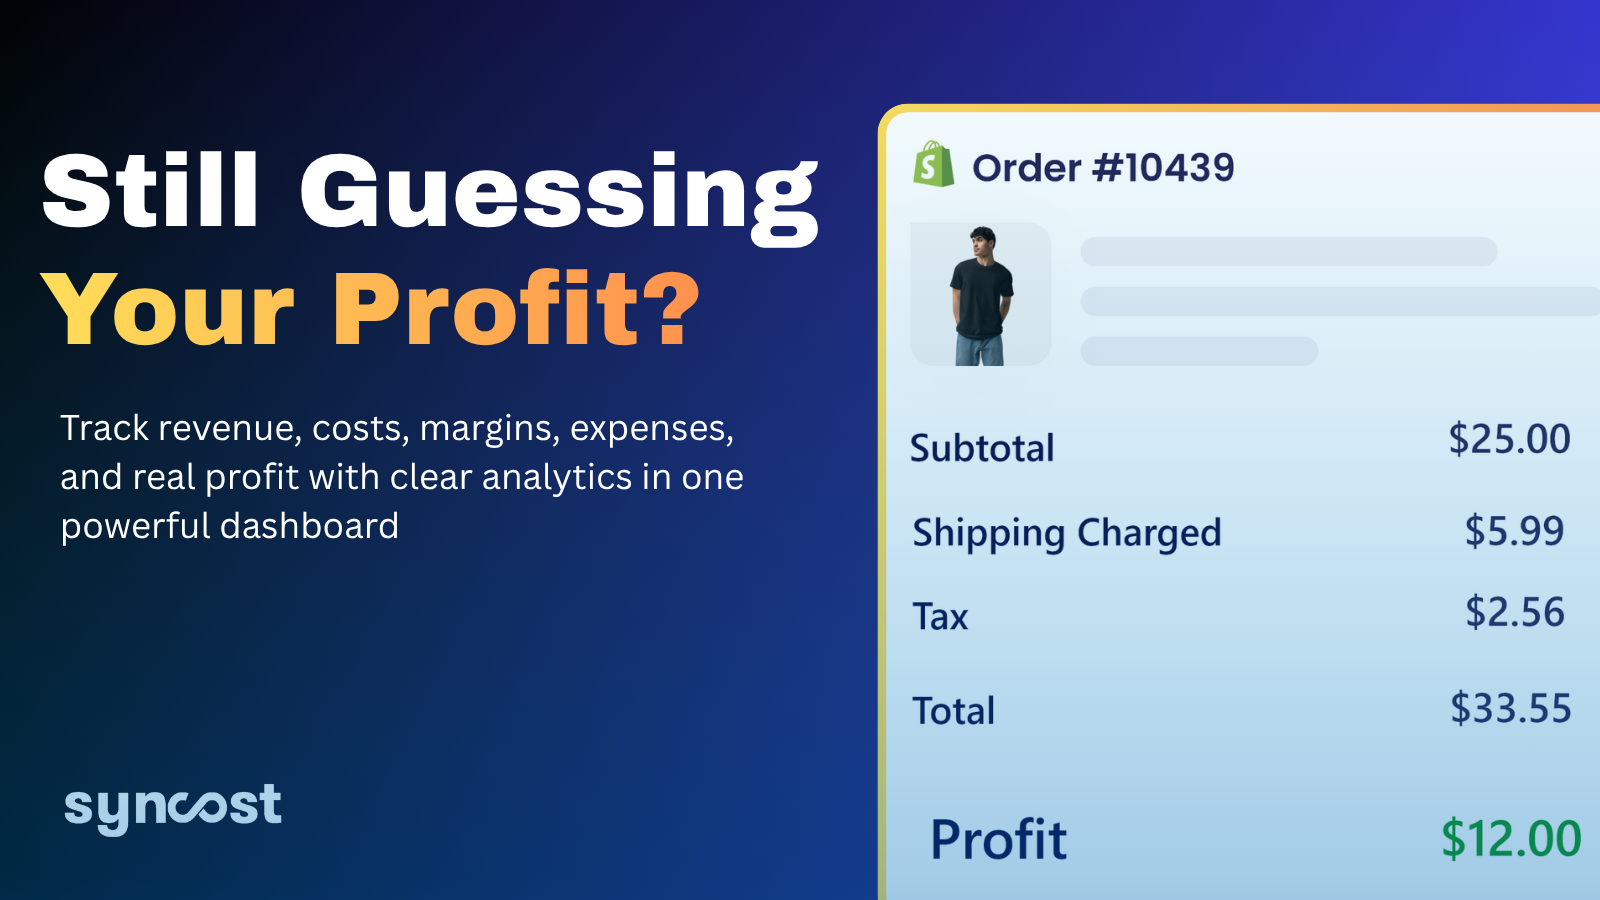
Syncost closes that gap for Shopify merchants. It automatically combines your product costs (COGS), Shopify fees, outbound shipping, and ad spend into a single per-order profit view — so the number you see on every sale reflects what you actually kept, not just what the product cost to source. When your supplier raises prices, it shows up in per-order margin immediately. When a POD platform's base cost changes, the impact is visible in the order data the same day. COGS is the foundation. Real-time per-order profit is the complete picture — and Syncost is what connects the two.
COGS calculation methods and inventory costing approaches are general guidance only and do not constitute accounting or tax advice. Consult a qualified accountant before changing inventory costing methods or for guidance specific to your business structure and jurisdiction.