The CAC Payback Trap: Why Relying on LTV to Save Unprofitable Ad Spend Will Bankrupt Your Shopify Store
Many e-commerce founders justify losing money on initial customer acquisition by banking on theoretical Lifetime Value (LTV) repeat purchases. Discover how extended CAC payback periods silently drain working capital, and learn how to optimize for immediate first-order contribution margins.

The Hook & The Silent Problem
Your media buyer sends you a end-of-week Slack message celebrating a 1.8x ROAS on a new Meta scaling campaign. You look at your Shopify dashboard: customer acquisition is up 40%, and your gross revenue curve is angling sharply upward. But when you check your net cash balance, you notice an unsettling trend—your operating bank account is losing capital every single week.
When you question the unit economics, your team offers a familiar defense: "We are acquiring customers at a slight loss on the first purchase, but our 90-day Lifetime Value (LTV) and repeat purchase rate will make these cohorts wildly profitable over time."
This is the classic CAC Payback Trap, and it is one of the most frequent causes of insolvency among high-growth D2C brands.
Banking on future repeat orders to cover today's ad spend assumes your business has infinite cash liquidity to bridge the gap. Meta, Google, and TikTok require payment for ad impressions within 30 days (or instantly via credit card). Your factory requires upfront deposits for inventory replenishment long before that inventory is sold. Your 3PL bills you weekly for fulfillment labor.
If your Customer Acquisition Cost (CAC) takes 90, 120, or 180 days to be fully recovered through repeat purchases, every new customer you acquire creates an immediate, negative cash flow position. Scaling under these conditions doesn't build enterprise value—it exponentially accelerates your working capital burn until your cash reserves hit zero.
Core Concept Explained (The Quick Answer)
CAC Payback Period is the exact number of days or months required for an e-commerce store to fully recover the cash spent acquiring a customer through the contribution margin generated by their purchases. First-Order Contribution Margin (CM1) represents the actual liquid cash remaining from a customer's initial transaction after deducting Landed COGS, payment processing fees, and 3PL fulfillment costs, serving as the immediate defense against acquisition spend.
The Deep-Dive Reference Guide
Understanding how your CAC payback horizon impacts your operational risk requires mapping your capital requirements against payback timing.
| Payback Horizon | Cash Flow Reality | Operational Risk Level | Working Capital Requirement |
|---|---|---|---|
| Day 0 (Immediate) | First-order Contribution Margin 1 (CM1) exceeds Blended CAC. The transaction is instantly cash-flow positive. | Ultra-Low Risk. The business funds its own customer acquisition continuously. | Minimal. Cash recycles instantly into ad spend and inventory replenishment. |
| 30 to 60 Days | First order breaks even or operates at a slight loss; recovered on the second purchase within 8 weeks. | Moderate Risk. Managed easily if customer retention metrics are historically stable. | Low to Moderate. Requires a modest cash buffer to cover the 30-60 day float. |
| 90 to 180 Days | Significant loss on initial acquisition; heavily dependent on aggressive email/SMS retention flows. | High Risk. Vulnerable to iOS privacy changes, ad platform volatility, and inventory supply shocks. | Heavy. Requires significant cash reserves or external debt financing to fund ad scale. |
| 180+ Days (1 Year+) | Severe cash burn. The brand acts as an un-hedged lender to its customer base, praying for future conversion. | Critical Risk. Highly unsustainable for bootstrapped or low-margin Shopify stores. | Extreme. Often leads to debt default or severe equity dilution to survive. |
Technical Breakdown & Formulas
Evaluating your payback dynamics requires moving beyond top-line ROAS and calculating your exact First-Order Net Cash Flow and Payback Duration.
First-Order Contribution Margin 1 (CM1) Formula:
CM1 = First_Order_AOV - Landed_COGS - Payment_Gateway_Fees - Pick_Pack_And_Shipping_Costs

First-Order Net Cash Position:
First_Order_Net_Cash = CM1 - Blended_CAC

CAC Payback Period (in Months) for Unprofitable First Orders:
CAC_Payback_Period = (Blended_CAC - First_Order_CM1) / Monthly_Repeat_CM1_Per_Customer

Where:
- Blended_CAC: Total Marketing Spend / Total New Customers Acquired (across all paid and organic channels).
- Monthly_Repeat_CM1_Per_Customer: The average monthly contribution margin generated by repeat purchases divided by total acquired customers in that cohort.
The Fatal Flaw in Standard ROAS: If your product retails for $100 and your variable costs (COGS + Shipping + Gateway) total $50, your break-even ROAS is 2.0x. If your ad platform reports a 1.8x ROAS ($55.55 CPA), you lose $5.55 in physical cash on every single new customer order. A 1.8x ROAS feels like "almost breaking even," but when multiplied across thousands of orders, it creates a massive structural cash deficit.
The Scaled Financial Impact (What It Actually Costs You)
To understand how extended payback periods destroy solvency during growth spurts, let's contrast two e-commerce brands scaling from 100 new customers per month to 5,000 new customers per month. Both stores sell products at an average price point of $100.
Store A: Optimized for Day 0 Payback
- Average Order Value (AOV): $100.00
- Variable Delivery Costs (COGS + 3PL + Fees): $45.00
- First-Order CM1: $55.00
- Blended CAC: $40.00
- First-Order Net Cash Position: +$15.00 (Cash Positive)
Store B: The "LTV Dependent" Model
- Average Order Value (AOV): $100.00
- Variable Delivery Costs (COGS + 3PL + Fees): $45.00
- First-Order CM1: $55.00
- Blended CAC: $75.00 (Aggressive media buying strategy)
- First-Order Net Cash Position: -$20.00 (Cash Negative)
- Store B's retention model predicts recovering that $20 loss over a 120-day repeat purchase window.
The Cash Flow Reality at Scale
At 100 Customers / Month:
- Store A: Generates +$1,500 net cash in Month 1.
- Store B: Loses -$2,000 net cash in Month 1. (Manageable out of existing bank reserves).
At 5,000 Customers / Month (Scaling Phase):
- Store A: Generates +$75,000 in net liquid cash every single month. This cash immediately funds the next round of inventory production and ad spend. Store A can scale infinitely without taking on debt.
- Store B: Incurs an immediate -$100,000 cash deficit in Month 1 alone.
The Compounding Deficit: By Month 4, Store B has generated a cumulative cash deficit of -$400,000. Even if its 120-day repeat purchase projections hold 100% true and older cohorts finally start returning cash, Store B must continually find $400,000 in working capital just to maintain its current acquisition rate. If ad costs rise by 10% or repeat rates dip by 5%, Store B enters a severe liquidity crisis and faces sudden bankruptcy.
Strategic Execution (How to Apply This to Your Business)
To escape the payback trap, you must restructure your unit economics to achieve immediate first-order profitability or drastically compress your payback horizon under 30 days.
-
Isolate First-Order vs. Repeat Analytics: Identify true first-order margin. Stop viewing overall store ROAS as a unified metric. Separate your ad performance metrics into First-Order Acquisition CAC and Retargeting/Retention CAC. Ensure that your acquisition campaigns are evaluated strictly against First-Order Contribution Margin 1 (CM1), not blend-inflated top-line revenue.
-
Optimize First-Order AOV via Pre-Purchase Bundling: Engineered checkout expansion. If your CAC is $50 and your CM1 margin is 50%, an AOV of $80 leaves you with a $10 loss per order ($40 CM1 - $50 CAC). Increasing your AOV to $110 via pre-purchase bundles, volume tiers, or free-shipping thresholds raises your CM1 to $55.00, turning that exact same ad campaign into an immediate $5.00 cash-positive transaction.
-
Automate 30-Day Post-Purchase Cross-Sells: Compress the retention cycle. If you must rely on repeat purchases to break even on CAC, concentrate your post-purchase marketing efforts within the first 30 days of the customer lifecycle. Implement automated, hyper-targeted email and SMS replenishment flows immediately following delivery to capture repeat margin before your ad billing cycle closes.
-
Establish Dynamic Ad Spend Ceilings: Align ad spend with capital constraints. Tie your daily advertising budgets directly to your liquid cash reserves. If your CAC payback period is currently 60 days, cap your monthly ad spend at a level that your business can comfortably fund for two consecutive months without relying on external financing or emergency loans.
Frequently Asked Questions (FAQ)
What is a healthy CAC Payback Period for a bootstrapped e-commerce brand?
For bootstrapped e-commerce brands operating without venture capital funding, the target CAC payback period is 0 to 30 days. Achieving first-order break-even (Day 0) ensures that your business can fund its growth through organic cash flow, protecting you from cash crunches and reliance on high-interest merchant cash advances.
Why is relying on 1-year Lifetime Value (LTV) dangerous for D2C brands?
1-year LTV is a dangerous metric because it ignores cash flow timing. While a customer may generate $200 in gross margin over a 12-month period, you must pay for their acquisition on Day 1. Waiting 365 days to collect your full margin creates a massive, long-term working capital float that most small-to-midsize e-commerce brands cannot afford to maintain.
What is the difference between Blended CAC and Platform CPA when calculating payback?
Platform CPA (e.g., Meta Ads Manager reported cost per acquisition) only accounts for tracked conversions directly attributed to that single channel, often missing view-through nuances and cross-device drop-offs. Blended CAC divides your total sales and marketing spend across all channels by your total new customer volume. Always use Blended CAC to calculate true payback to avoid underestimating your true acquisition costs.
How do subscription models impact the CAC payback calculation?
Subscription models naturally extend acceptable CAC payback periods because customer retention is predictable and recurring revenue is contractually locked in. If your churn rate is low and predictable, you can safely sustain a 60-to-90 day CAC payback period because future cash flows carry significantly lower risk compared to one-time transactional retail models.
From Financial Chaos to Verified Profit
Relying on theoretical Lifetime Value projections to cover immediate, cash-draining customer acquisition costs is a high-risk gamble that routinely destroys high-growth Shopify stores. When your ad platform reports vanity ROAS metrics while uncalculated CAC payback delays silently erode your bank balance, true financial control disappears.
You cannot manage your cash flow velocity if your reporting tools do not calculate real-time, bottom-up net profit.
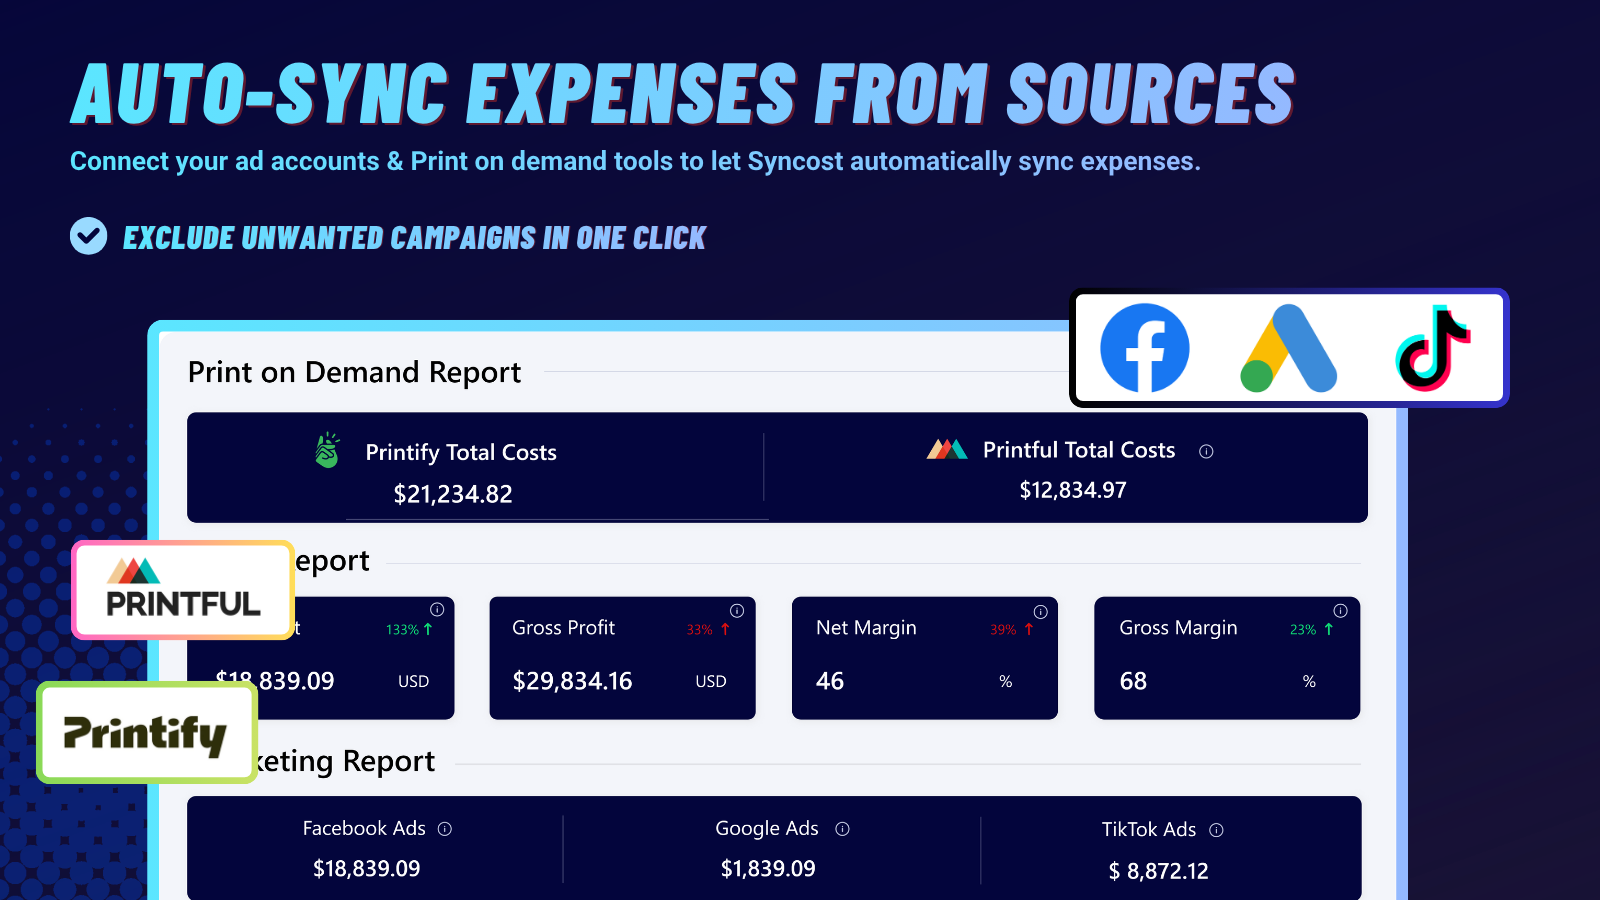
This is precisely why analytical e-commerce operators build their unit economics on Syncost.
Syncost restores mathematical absolute truth to your Shopify analytics. By automatically pulling live ad spend across all paid channels and combining it with your exact Landed COGS, custom 3PL fulfillment expenses, and payment processing fees, Syncost calculates your true First-Order Contribution Margin and dynamic CAC Payback metrics in real time.
Stop guessing whether your ad scaling is generating cash or draining your business. Install Syncost today, master your true unit economics, and scale your brand on verified net profitability.