Customer Acquisition Cost (CAC): How to Calculate and Cut It
Customer acquisition cost is up 40% in two years — and most merchants are still using a calculation that understates it by 40–60% by excluding agency fees, creative costs, and tools. Here's the correct CAC formula, 2026 benchmarks by vertical and channel, the LTV:CAC ratios that signal health or trouble, and seven specific levers that actually reduce it.

Customer acquisition cost is the most consequential number in your ecommerce business that most merchants either miscalculate or don't track at all. It determines whether your advertising is profitable, whether your business model is sustainable at scale, and whether growing revenue is making you richer or just busier.
Average ecommerce CAC sits between $68 and $84 across categories — up 40% in just two years, driven by iOS privacy changes, ad auction inflation from mega-retailers, and rising CPCs across every major paid channel. If your customer acquisition cost hasn't become a number you monitor monthly, 2026 is the year that changes.
This guide covers how to calculate your real CAC (not the underestimated version most merchants use), what healthy looks like in your category, and the specific levers that actually reduce it.
What Customer Acquisition Cost Is
Customer acquisition cost is the total spend required to bring one new paying customer to your store. Every dollar you invest in marketing, advertising, or any activity designed to generate customers goes into this number — divided by the new customers those investments produced.
It sounds simple. The calculation is where most merchants go wrong.
How to Calculate CAC Correctly
The Basic Formula
CAC = Total acquisition spend ÷ New customers acquired
If you spent $4,000 on Meta ads in April and acquired 160 new customers, your paid CAC for April is $25.
What Belongs in "Total Acquisition Spend"
This is where most CAC calculations break down. Merchants typically include only their ad invoices and call it done. A complete CAC calculation includes:
Paid advertising: Meta, Google, TikTok, Pinterest, YouTube, display. Every ad platform invoice.
Agency and freelancer fees: If you pay a media buyer, creative agency, or ads manager, their fees are acquisition costs — they exist because you're running paid campaigns.
Creative production costs: Photography, video production, UGC creator fees, graphic design for ads. These assets exist to acquire customers.
Influencer and affiliate costs: Influencer fees, affiliate commissions, referral programme costs.
Tools and software: Attribution software, landing page builders, split-testing tools used specifically for acquisition campaigns.
Organic acquisition costs: SEO agency fees, content production costs for blog posts or social content designed to bring in new customers.
Email acquisition costs: Lead magnets, signup incentive discounts, popup tools. These create the subscriber who eventually becomes a customer.
A merchant who tracks only ad spend is almost always underestimating their real CAC — sometimes significantly. A complete CAC calculation includes salaries, tools, agency fees, and campaign costs — not just ad spend. At a typical mid-size DTC brand, the true all-in CAC can be 40–60% higher than the ad-spend-only version most dashboards report.
Paid CAC vs Blended CAC
Paid CAC is now 2.4× to 3.1× blended CAC across most ecommerce categories. The gap between blended CAC and paid CAC has widened materially since 2023, as organic, brand, and referral channels carry more weight than most teams realise.
Blended CAC divides total acquisition spend by all new customers — including those from organic search, social, and word of mouth. It's the healthier-looking number, because organic customers are "free" (after production costs).
Paid CAC divides paid channel spend by customers sourced specifically from paid channels. It's the number that determines whether your advertising programme is profitable.
Track both, and track them separately. Blended CAC tells you the overall efficiency of your acquisition model. Paid CAC tells you whether your ads work.
New Customer CAC vs Repeat Customer CAC
CAC should only count new customers — people making their first purchase. Including repeat customers in the denominator artificially deflates the number. A campaign that reactivated 50 lapsed customers and acquired 30 new ones didn't generate 80 customers for your CAC calculation — it generated 30.
Correct CAC = Acquisition spend ÷ First-time buyers only
What Your CAC Should Be: 2026 Benchmarks
A CAC number in isolation tells you nothing. The only way to evaluate it is against two things: your gross profit per order and your LTV:CAC ratio.
By Vertical
Average ecommerce CAC ranges from $53 to $377+ depending on vertical. Fashion runs $90–$120, beauty $90–$130, pet care $68–$90, food and beverage $53–$100, and electronics $100–$377 or more.
| Vertical | Average CAC range (2026) |
|---|---|
| Food & beverage | $53–$100 |
| Pet care | $68–$90 |
| Apparel & fashion | $90–$120 |
| Health & beauty | $90–$130 |
| Home & furniture | $100–$150 |
| Electronics | $100–$377+ |
| Luxury goods | $150–$300+ |
The variation within each category is enormous — a pet brand selling via influencer partnerships will have a very different CAC from one dependent on Google Shopping. Use these as directional references, not hard targets.
The LTV:CAC Ratio
The most useful CAC benchmark isn't a dollar figure — it's the ratio of lifetime value to acquisition cost.
A 3:1 LTV:CAC ratio is the minimum for sustainability. Most DTC brands should aim for 3:1 to 4:1. A ratio above 5:1 often means you're under-spending on growth and leaving market share on the table. A ratio of 2:1 or less is a warning sign — you're close to break-even, and overhead costs can easily tip you into loss.
| LTV:CAC ratio | What it means |
|---|---|
| Below 1:1 | Every acquisition destroys value |
| 1:1 to 2:1 | Marginal — no room for error |
| 3:1 to 4:1 | Healthy — sustainable paid acquisition |
| Above 5:1 | Strong — consider increasing spend |
The Break-Even CAC
For single-purchase products, your break-even CAC is simply your gross profit per order. If gross profit is $24 and CAC is $25, you're acquiring customers at a loss on the first order. For repeat-purchase products, break-even extends across the expected order sequence:
Break-even CAC = Gross profit per order × Expected number of orders before churn
At $24 gross profit and an average of three orders before churn, break-even CAC is $72. A $50 CAC in this scenario is highly profitable; a $75 CAC is a loss.
Why CAC Has Risen 40% in Two Years
Three big reasons: iOS privacy changes (only 25% of iOS users opted in to tracking), ad auction inflation from giants like Amazon and Temu, and more DTC brands bidding on the same keywords. Google CPCs rose 12.88% year-over-year in 2025 and Meta CPMs rose 20%.
Understanding the cause of rising CAC is the prerequisite for reducing it — because the fixes differ depending on which driver is hitting your business hardest.
iOS attribution loss means your Meta campaigns appear less efficient than they are, because conversions aren't being reported back accurately. The fix is server-side tracking via the Conversions API (CAPI), which bypasses browser-level tracking restrictions and recovers the attributed conversions your pixel is missing. Many stores operating on a reported $35 paid CAC discover their real CAC is $22–$25 once CAPI is properly configured.
Ad auction inflation from larger advertisers means the same targeting costs more per click than it did 18 months ago. The fix is creative quality and relevance — ads that earn higher click-through rates reduce your CPM relative to competitors on the same audience, effectively buying impressions more efficiently.
Category saturation means broad-audience campaigns for common product types compete against dozens of similar advertisers. The fix is audience specificity — tighter creative hooks that self-select higher-intent audiences, or narrower geographic and demographic targeting that reduces competition.
The Seven Levers That Actually Cut CAC
1. Build Organic Channels That Generate Zero-CAC Orders
The most powerful CAC reduction isn't cheaper ads — it's building acquisition channels where the marginal customer costs nothing. A well-ranked blog post that brings in 40 new customers a month has a $0 CAC on those customers forever (after the one-time production cost). An email list that generates 100 orders per send has an effective CAC of near-zero on those orders.
Influencer-generated content delivers roughly 30% lower cost per acquisition than brand-produced content. Micro-influencers cost 60–70% less than macro-influencers while producing higher engagement rates.
The stores that improve their blended CAC over time are almost always the stores investing in channels that take time to compound — SEO, email, community, referral — alongside paid channels that produce immediate results. Paid channels get you customers now; organic channels reduce what every future customer costs.
2. Improve Creative to Lower Cost Per Click
Ad creative is the primary targeting mechanism in 2026's Meta environment. A creative with a 3% CTR pays materially less per impression than one with a 1% CTR on the same audience — because the platform rewards relevance with lower CPMs. Better creative doesn't just convert better; it reaches customers more efficiently.
AI-assisted creative and bidding has cut paid CAC 14% on average, with the top decile reporting 28% CAC reduction year-over-year. Testing creative hooks at the first three seconds of a video, with a systematic process of generating 15–20 variations and killing the weakest performers, consistently outperforms the standard approach of producing one well-produced piece and running it to creative fatigue.
3. Optimise Your Conversion Rate
CAC is a function of two things: what you pay to reach potential customers, and how many of them convert. Improving conversion rate reduces CAC without reducing ad spend. A store converting 2.5% of paid traffic that lifts to 3.5% has reduced its effective paid CAC by 29% — from the same ad budget, reaching the same audiences, with the same creative.
The highest-CAC-reducing CRO investments: checkout friction removal (show total cost before the final step, enable guest checkout, add Shop Pay and Apple Pay), product page quality (accurate images, objection-answering descriptions, visible reviews), and page speed (every 0.1-second mobile improvement lifts conversion by approximately 1%).
4. Use Retargeting to Reach Warm Audiences at Lower Cost
Cold audience CPMs are at their highest ever. Retargeting audiences — past visitors, past purchasers, email subscribers — typically convert at three to five times the rate of cold audiences at lower CPMs. A retargeting campaign that converts 8% of past visitors at a $12 CPA significantly improves your blended CAC compared to running everything on cold prospecting.
Build your retargeting stack in this order: abandoned cart (highest intent), product page visitors (mid intent), all site visitors (low intent). Each tier should have distinct creative that acknowledges the visitor's familiarity with the brand rather than treating them as a cold prospect.
5. Reduce Churn to Improve LTV:CAC Without Touching CAC
LTV:CAC can improve two ways: cut CAC, or raise LTV. Improving customer retention — repeat purchase rate, subscription conversion, post-purchase engagement — raises LTV without changing what you spend on acquisition. A customer who buys three times instead of once generates three times the lifetime gross profit from the same acquisition investment, effectively tripling your LTV:CAC ratio.
A 5% increase in retention can boost profits by 25% to 95%. Customer retention costs 5 to 25 times less than acquisition. A well-built post-purchase email sequence, a loyalty programme, and a subscription offering on consumable products all reduce the effective cost of each customer over their lifetime — making the same CAC sustainable at much higher levels.
6. Shift Channel Mix Toward Higher-Efficiency Sources
Not all channels have the same CAC. Referral programmes typically generate customers at $10–$30 CAC — far below the paid channel average. Affiliate marketing, where you pay a commission only on actual purchases, caps your acquisition cost at a fixed percentage of revenue rather than a per-click rate that accumulates regardless of conversion. Email nurture converts at near-zero marginal CAC once the list exists.
Mapping your CAC by channel — not just blended — reveals which channels are subsidising which. Most stores running multiple acquisition channels find one or two delivering customers at 50–70% below the blended average and one or two significantly above it. Shifting budget toward the efficient channels and reducing the inefficient ones is the fastest path to blended CAC reduction.
7. Enable Server-Side Tracking to Fix Measurement
If you're running Meta without the Conversions API, you're almost certainly over-measuring your CAC because your attribution is undercounting conversions. iOS restrictions mean your pixel misses a significant portion of purchases. The result: campaigns look less efficient than they are, you cut spend that was actually working, and you make budget decisions on bad data.
Enable the Meta Conversions API through Shopify's native integration (Marketing → Connections → Meta) and compare reported conversions before and after. Most stores see 15–35% more attributed conversions once server-side tracking is in place — which recalculates every CAC figure they've been operating on.
Track Your CAC Against Real Per-Order Profit
CAC is only meaningful alongside your gross profit per order. A CAC of $18 is excellent on a $60 product with 55% gross margin ($33 gross profit). The same $18 CAC is thin on a $30 product with 30% gross margin ($9 gross profit) — leaving only $-9 per order before any fixed costs. The metric that tells you whether your CAC is sustainable isn't the number itself. It's the gap between CAC and gross profit per order on every channel and every product.
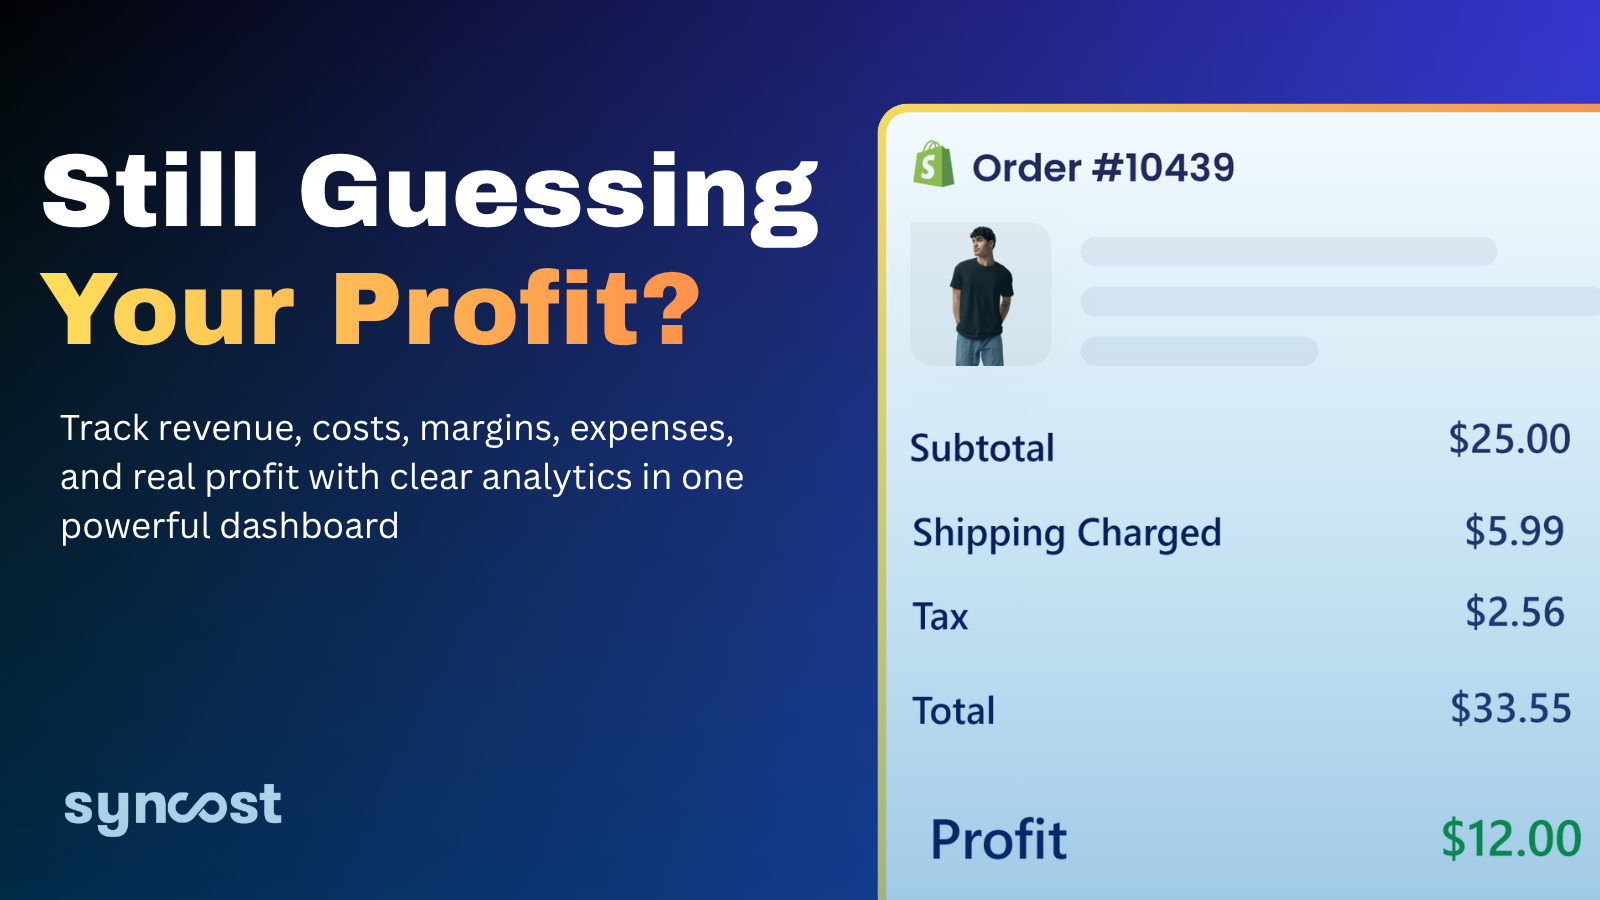
That per-order view — CAC measured against real gross profit, not estimated margin — is what Syncost builds automatically for Shopify merchants. It combines your actual product costs, Shopify fees, shipping, and ad spend into a per-order profit view, so you can see exactly which products and channels are generating real contribution margin after CAC and which ones look profitable until the full cost stack is applied. The goal isn't a lower CAC in isolation. It's a lower CAC relative to the profit each acquired customer generates — and that's a calculation you can only make accurately when you can see both numbers on every order.
CAC benchmarks reflect published 2026 data from Mobiloud, Ringly.io, Eightx, Digital Applied, and Affninja. Benchmarks vary significantly by vertical, channel mix, attribution methodology, and business model. Verify against your own account data before drawing conclusions.