The Attribution Mirage: Why Scaling Based on In-Platform CAC is a Guaranteed Path to Insolvency
Most merchants blindly trust their ad platform dashboards, unaware that double-attribution, agency retainers, and creative production costs make their true acquisition cost significantly higher. If you are scaling campaigns based on Facebook or Google's reported CAC instead of your Fully Loaded Blended CAC, you are actively driving your business into negative cash flow.

The Hook & The Silent Problem: The Dopamine Trap of the Ads Manager
E-commerce operators are notoriously addicted to their advertising dashboards. You refresh the Facebook or TikTok Ads app, see a $15 Customer Acquisition Cost (CAC) with a 4.0x ROAS, and immediately increase your daily budgets. It feels like printing money. But thirty days later, you run payroll, pay your suppliers, and check the corporate bank account—only to realize the cash balance has barely moved, or worse, has decreased.
This terrifying disconnect is known as the Attribution Mirage. The silent problem destroying scaling Shopify brands is the reliance on "In-Platform" metrics as a source of financial truth. Advertising networks are fundamentally designed to justify their own existence and encourage increased spending. They operate in algorithmic silos, gleefully claiming credit for every touchpoint while entirely ignoring the structural overhead required to run those ads. When you scale your ad spend based on a dashboard that omits your marketing agency's retainer, the cost of user-generated content (UGC) creation, email software fees, and cross-platform double-attribution, you are operating in a financial fantasy. You aren't scaling profit; you are scaling an invisible, deeply unprofitable operational bloat.
Core Concept Explained (The Quick Answer): Defining True Acquisition Costs
Fully Loaded Blended CAC is the true, comprehensive cost to acquire a single new customer across your entire business ecosystem. Unlike In-Platform CAC—which merely divides the ad spend on a specific network by the conversions that network arbitrarily claims—Fully Loaded Blended CAC incorporates all marketing overhead (agency fees, creative costs, software) and divides it strictly by the verified, deduplicated new customers recorded in your Shopify backend.
The Deep-Dive Reference Guide: Where Your Marketing Capital Actually Evaporates
To understand why your bank account doesn't match your Facebook dashboard, you must dissect the anatomy of your marketing ledger. Here is the unvarnished truth of what comprises a true acquisition cost:
| Expense Category | Accounted for by Ad Platforms? | Impact on True Blended CAC |
|---|---|---|
| Direct Platform Media Spend | Yes (100%) | Baseline Cost |
| Cross-Platform Attribution Overlap | No (FB and Google double-count) | Artificially Lowers Perceived CAC |
| Agency / Media Buyer Retainers | Never | Moderate to Extreme (Fixed Overhead) |
| Creative Production (UGC, Shoots) | Never | High (Continuous Variable Expense) |
| Marketing Tech Stack (Email/SMS, Pop-ups) | Never | Moderate (Scales with database size) |
| Discount Code Margin Loss | Never (Tracks Gross Revenue) | Severe (Reduces actual cash collected) |
Technical Breakdown & Formulas: The Math of Marketing Reality
To eliminate the guess-work that leads to e-commerce bankruptcies, you must abandon ad-platform reporting as your primary financial compass. You need to calculate profitability from a top-down, ruthless accounting perspective.
First, observe the fundamentally flawed formula provided by ad networks:
In-Platform CAC = (Specific Channel Media Spend) / (Conversions Claimed by Channel's Pixel)
Now, replace that with the Fully Loaded Blended CAC Formula. This calculation strips away algorithmic bias and factors in the unavoidable fixed costs of running a marketing department:
Fully Loaded Blended CAC = (Total Ad Spend All Channels + Agency Fees + Creative/UGC Costs + Marketing SaaS Fees) / (Total Unique NEW Customers in Shopify)
Finally, to understand how this impacts your survival, calculate your True Marketing Contribution Margin:
True Contribution Margin = (Average Order Value - Total COGS - Fulfillment Logistics) - Fully Loaded Blended CAC
The CFO's Reality Check: If Facebook claims 60 conversions and Google claims 60 conversions, but your Shopify backend only shows 85 total orders for the day, you have a 30% attribution overlap. Your ad platforms are lying to you about your efficiency by claiming credit for the exact same customers.
The Scaled Financial Impact (What It Actually Costs You): 100 vs. 5,000 Customers
Let us map out a highly realistic scenario using a consumer electronics product retailing at $150.00.
- Landed COGS: $40.00
- Fulfillment & Shipping: $15.00
- Gross Margin Before Marketing: $95.00
- Target Profit Margin: $25.00 (Meaning you think you can afford up to a $70 CAC).
You hire an agency for $5,000/month and spend $3,000/month on UGC creators.
The Flawed In-Platform Dashboard View (At 100 Sales):
- Facebook Ad Spend: $4,500
- Facebook Claimed Sales: 100
- Reported In-Platform CAC: $45.00
- Illusion of Profit: The merchant assumes they are making $50 per unit ($95 Gross Margin - $45 CAC). They believe they netted $5,000 in profit.
The True Fully Loaded Reality (At 100 Sales):
- Total Ad Spend: $4,500
- Agency Retainer Allocation: $5,000
- Creative Production Allocation: $3,000
- Actual Total Marketing Capital Deployed: $12,500
- Verified New Shopify Customers: 100
- Fully Loaded Blended CAC: $125.00
- The Financial Reality: ($95 Gross Margin - $125 True CAC) = -$30.00 Net Loss per unit.
- Actual Bank Impact: -$3,000 Net Loss.
At 5,000 Customers (The Danger Zone of Scale): Encouraged by the fake $45 In-Platform CAC, the merchant demands the agency scale the spend. At higher volume, creative costs rise to $15,000/mo, the agency takes a % of spend ($12,000), and ad spend jumps to $250,000.
- Total Ad Spend: $250,000
- Agency & Creative Overhead: $27,000
- Total Marketing Capital: $277,000
- Verified New Shopify Customers (accounting for 20% organic/returning overlap that ads falsely claim): 4,000 real new customers.
- Fully Loaded Blended CAC: $69.25
- The Financial Reality: ($95 Gross Margin - $69.25 True CAC) = $25.75 Profit per unit.
- Total Actual Profit: $103,000.
The Catastrophic Disconnect: If you looked at Facebook, which claimed 5,000 sales at a $50 CAC, you would have projected $225,000 in profit. A staggering $122,000 in expected cash is completely missing because you failed to account for fixed marketing overhead, double-attribution, and the true baseline volume of your organic sales.
Strategic Execution (How to Apply This to Your Business):
- Enforce Zero-Based Attribution: Stop managing your business inside Ads Manager. Create a daily ledger that tracks "Total Store Orders" against "Total Daily Marketing Outflow" (including daily prorated agency and software costs). Judge your marketing success strictly by total store profitability, not channel-specific ROAS.
- Audit Your Agency's Performance on Blended Metrics: Marketing agencies love to report on in-platform ROAS because it looks impressive. Force your agency to report on MER (Marketing Efficiency Ratio: Total Store Revenue / Total Ad Spend) and Blended CAC. If your agency refuses to be judged by your Shopify backend data, fire them.
- Calculate Your Break-Even Blended CAC Daily: Your COGS and shipping rates fluctuate. You must constantly recalculate your maximum allowable Fully Loaded CAC. If your Fully Loaded CAC breaches your Gross Margin threshold, you must pause scaling immediately and fix your creative pipeline or product pricing, regardless of what Facebook says.
Frequently Asked Questions (FAQ)
Why do Facebook and Google claim the same sale?
Ad platforms operate on a "last-click" or "view-through" attribution model within their own closed ecosystems. If a customer sees a Facebook ad on Monday, but searches for your brand on Google and clicks a Search ad to buy on Wednesday, both Facebook and Google will record a 100% conversion value for that single sale on their respective dashboards.
Should I turn off my ads if my In-Platform ROAS is high but my Net Profit is negative?
Yes. Ad platforms do not pay your bills. A 5.0x ROAS is entirely meaningless if the cost of your product, shipping, agency retainers, and overhead exceeds the revenue generated. High ROAS with negative cash flow usually means your product pricing is fundamentally broken or your fixed marketing overhead (agencies/SaaS) is too heavy for your current volume.
How do I properly account for returning customers in CAC?
Returning customers should ideally cost you zero in paid media (or very little via email/SMS). To find your true acquisition efficiency, you must strip returning customer orders out of your denominator. Divide your total marketing spend only by first-time, new customers to see exactly what it costs to acquire fresh market share.
From Financial Chaos to Verified Profit
Managing e-commerce marketing spend using fragmented platform dashboards is financial suicide. Relying on spreadsheets to manually aggregate your ad spend, agency fees, and Shopify backend data inevitably leads to delayed decision-making and catastrophic margin degradation.
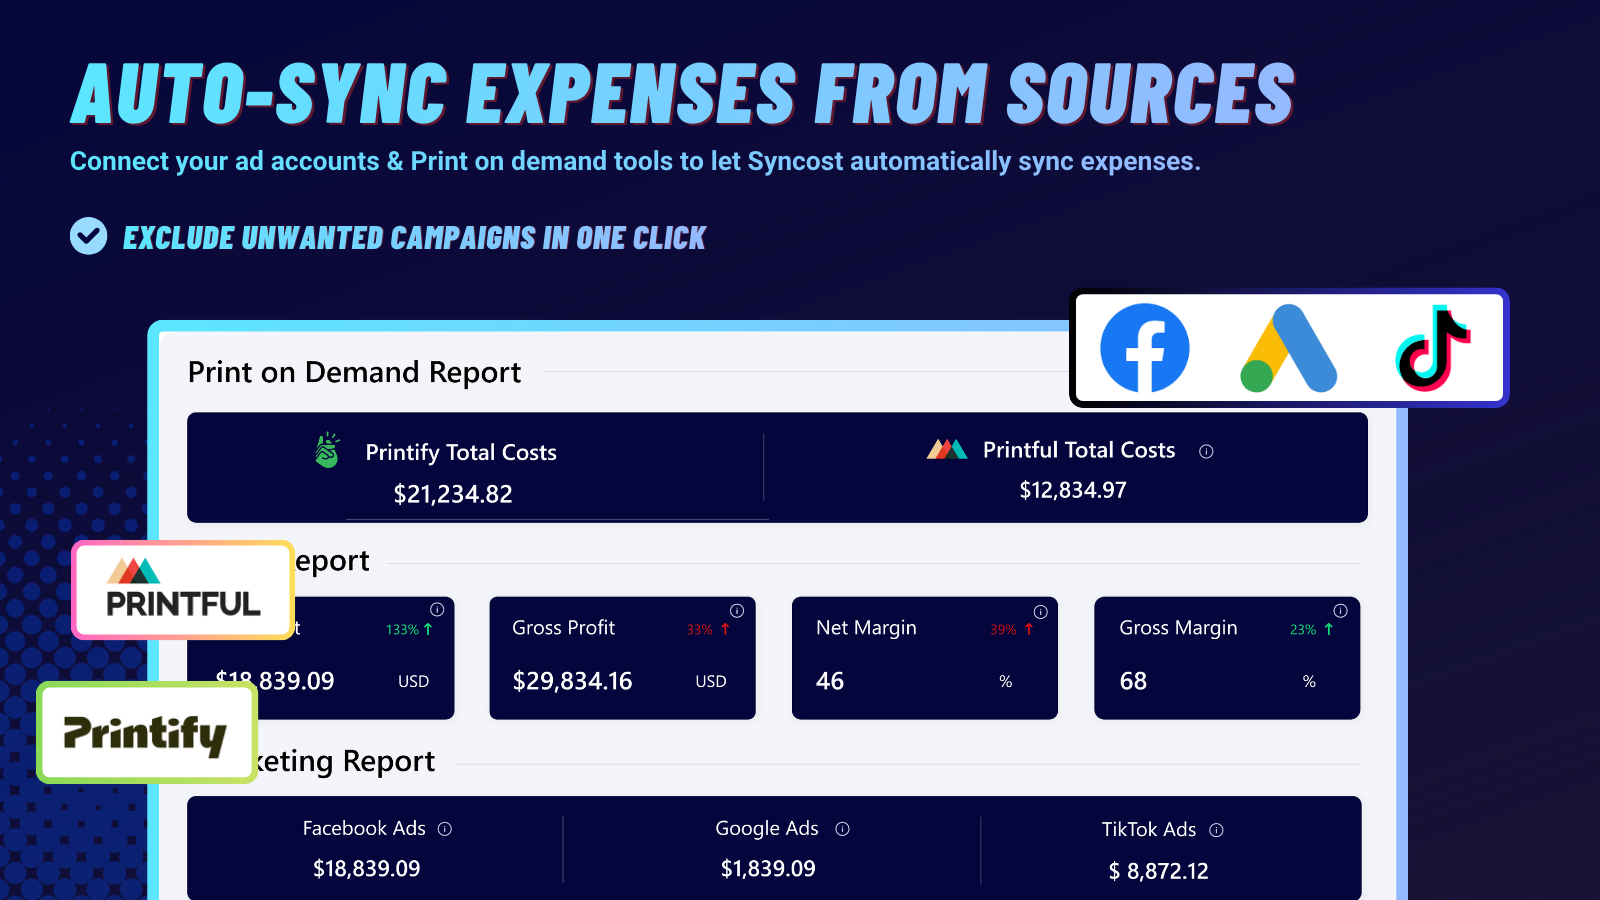
Syncost is engineered to obliterate the attribution mirage. By seamlessly ingesting real-time data from your Shopify backend, multiple ad networks, and your customized overhead expenses, Syncost provides an uncompromising, unified view of your Fully Loaded Blended CAC. It automatically deduplicates platform claims and subtracts your true COGS and logistics costs, delivering the absolute, bottom-up net profit of your store in real time. Stop betting your company's cash flow on algorithmic vanity metrics. Let Syncost deliver the verified financial visibility you need to scale your marketing budget with absolute certainty.