Meta and TikTok Ads: How to Know If Your Campaigns Are Really Profitable
Your ad dashboard says your campaign is a winner, but your bank account disagrees. Learn why platform numbers can mislead you, which metrics to trust instead, and how to decide what to scale, fix, or turn off.

Advertising is the engine of many Shopify stores. It is also where the most money gets wasted. A campaign can show a "good" ROAS in Meta or TikTok Ads Manager and still lose money once you count what the product actually costs you.
The reason is simple: ad platforms measure revenue, but your business lives on profit. In this guide, we'll look at why the numbers don't always match, which metrics give you a truer picture, and how to make clear decisions about each campaign.
Why Ad Platform Numbers Can Mislead You
Ads Manager is useful, but it has built-in limits you should know about.
It doesn't know your costs. The platform sees a sale of $60. It does not know your product cost, shipping, fees, or refunds. A "3.0 ROAS" looks great until you find your margin is thin.
Attribution is generous. Platforms count a sale if the customer clicked or viewed an ad within a certain window (often a few days, and sometimes including views without a click). A customer who would have bought anyway can still be counted as an ad sale.
Platforms can overlap. If a customer saw ads on both Meta and TikTok before buying, both may claim the sale. Add the numbers from each platform together and you may get more sales than your store really had.
Tracking is imperfect. Privacy settings, browsers, and device changes can hide or distort some data, so some sales are missing and others are misattributed.
None of this means you should ignore Ads Manager. It means you should use it for what it is good at (comparing creatives, audiences, and trends) and check your real profit somewhere else.
The Metrics That Matter
ROAS (Return on Ad Spend)
ROAS = Revenue from ads ÷ Ad spend
Useful for comparing campaigns, but it is only meaningful next to your break-even ROAS, the point where you make zero profit.
Break-even ROAS = 1 ÷ Margin before ads
CPA (Cost Per Acquisition)
CPA = Ad spend ÷ Number of orders
This is how much you pay to get one order. Compare it with your break-even CPA, which is the profit you make on an order before ads. If your CPA is higher, you lose money on each sale.
MER (Marketing Efficiency Ratio)
MER = Total revenue ÷ Total ad spend
MER uses your total store revenue and all ad spend together, across every platform. Because it doesn't depend on attribution, it is harder to distort. Many store owners use it as the "truth check" for their overall advertising.
Contribution Profit After Ads
Profit = (Orders × Profit per order before ads) − Ad spend
This is the number that matters in the end. It tells you what advertising actually left in your pocket.
A Worked Example
Let's say your product sells for $60. Your costs before ads are:
| Cost | Amount |
|---|---|
| Product cost | $24.00 |
| Shipping | $7.00 |
| Payment fees (about 2.9% + $0.30) | $2.04 |
| Profit per order before ads | $26.96 |
Wait, let's recompute carefully: $60 − $24 − $7 − $2.04 = $26.96. So:
- Margin before ads: 26.96 ÷ 60 = 44.9%
- Break-even ROAS: 60 ÷ 26.96 = 2.23
- Break-even CPA: $26.96
Now look at two campaigns, each with $1,000 of spend.
Campaign A reports a ROAS of 3.0.
- Revenue: $3,000, which is 50 orders
- CPA: $1,000 ÷ 50 = $20
- Profit: (50 × $26.96) − $1,000 = $1,348 − $1,000 = +$348
Campaign B reports a ROAS of 2.0.
- Revenue: $2,000, which is about 33 orders
- CPA: about $30
- Profit: (33.3 × $26.96) − $1,000 = about $899 − $1,000 = −$101
Both campaigns might look "positive" in the dashboard, since both have a ROAS above 1. But Campaign A makes money, and Campaign B loses it.
Combined, the two campaigns spent $2,000 and reported $5,000 in revenue, a blended ROAS of 2.5. Total profit: $348 − $101 = +$247. A blended number can look fine while hiding a campaign that should be stopped.
What Else Changes the Result
Your real profit can be lower than this example because of:
- Refunds. A sale that is returned stays in the platform's revenue in some views, but you lose the money.
- Discounts. If a promo code lowers the price, your margin and break-even ROAS change.
- Free or heavy shipping. Costs vary by country and product.
- Customer lifetime value. On the other side, if customers buy again, you can accept a lower first-order profit. This is a deliberate choice, and it should be based on real repeat-purchase data, not hope.
How to Decide What to Do With Each Campaign
Use simple rules, based on your own break-even numbers.
Scale a campaign when its CPA is clearly below your break-even CPA, results are stable over several days, and you have enough orders to trust the data.
Fix a campaign when it is close to break-even. Test new creatives, hooks, offers, landing pages, and audiences before touching the budget.
Turn off a campaign when it stays well above break-even CPA after enough spend and enough data, and testing hasn't helped.
Wait when there isn't enough data. A campaign with 3 orders tells you very little. A common guideline is to let a test spend roughly 2 to 3 times your break-even CPA before judging it, though the right number depends on your store.
Scaling Without Killing Your Profit
When a campaign works, the temptation is to double the budget overnight. This often backfires, because performance can change and the platform may need time to adapt.
- Raise budgets gradually. Many advertisers increase by around 20% every few days.
- Watch CPA and MER as spend grows. If CPA rises above break-even, pause the increase.
- Add new creatives regularly. Ads get tired, and fresh ones help keep costs down.
- Scale by duplicating a winning campaign as well, not only by raising its budget.
Meta vs TikTok: Different Roles
The two platforms often behave differently, so don't judge them by exactly the same standards.
- Meta often works well for direct sales and retargeting, with more mature tools.
- TikTok can be strong for discovery and creative testing, and often needs a steady supply of fresh video.
- A customer may discover you on TikTok and buy later after seeing a Meta ad. This is one more reason to use MER and total profit to judge the whole picture, not only each platform's own report.
Common Mistakes
- Judging by ROAS alone, without knowing break-even ROAS
- Using estimated costs instead of real, current ones
- Adding up platform revenue from several platforms as if it were true sales
- Ignoring refunds and discounts in the profit calculation
- Changing budgets too fast
- Switching off campaigns too early, before there is enough data
- Leaving losing campaigns on because the dashboard "looks positive"
A Simple Weekly Routine
- Pull your total sales and total ad spend for the week, and calculate MER.
- Check CPA and ROAS for each campaign against your break-even numbers.
- Calculate your profit after ads, including refunds.
- Pick one campaign to scale, one to fix, and one to turn off or test again.
- Write down what you changed, so you can see the effect next week.
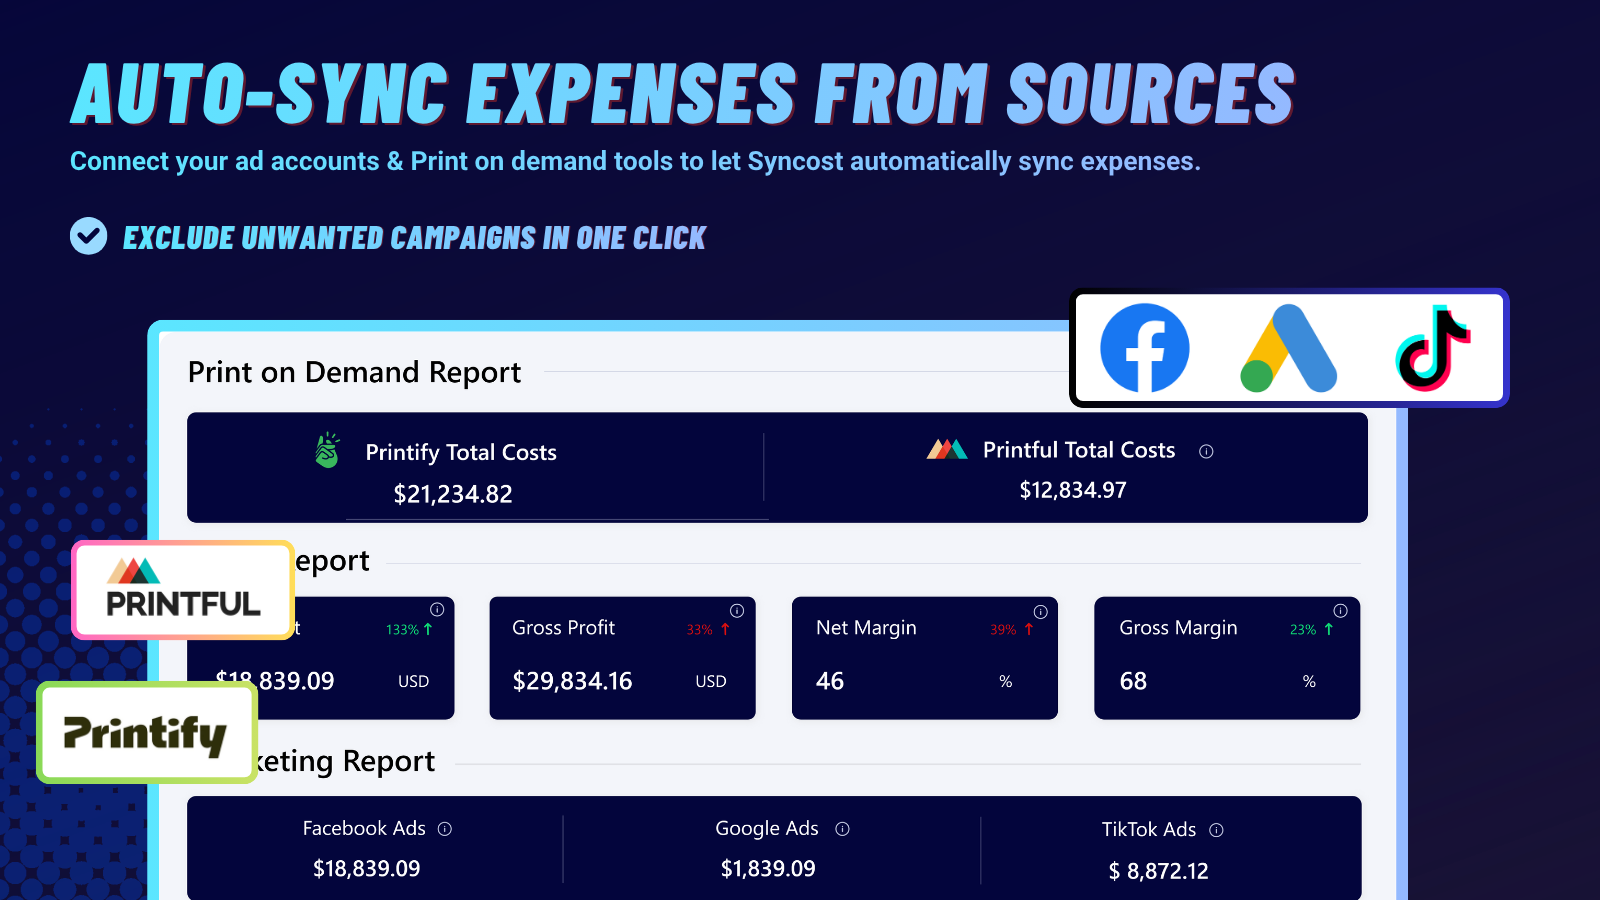
If doing this by hand takes too long, connecting your store, costs, and ad accounts in one place helps. For example, Syncost brings your orders, costs, and ad spend together, so you can compare profit and ad cost without separate spreadsheets.
Key Takeaways
- Ad platforms measure revenue, not profit, and they can over-count sales.
- Know your break-even ROAS and break-even CPA before judging any campaign.
- Use MER as a reality check on your overall advertising.
- Judge campaigns by profit after ads, including refunds and discounts.
- Scale gradually, test fresh creatives, and give campaigns enough data.
- Review weekly and act on the numbers.
The goal of advertising isn't a high ROAS, it is a growing profit. Calculate your break-even numbers this week, and compare them with your active campaigns. You may find a campaign worth scaling, and one that has been quietly costing you money.